Think about how complicated software can be these days. You’ve got all these different parts talking to each other – the stuff you see on the screen, the behind-the-scenes processing, the databases, and all the computers that make it run. When something goes wrong in this big mess, figuring out what caused it can feel like trying to find a needle in a haystack. Teams often end up using a bunch of different monitoring tools, and each one only shows a small piece of the puzzle. This makes fixing problems take way too long, which is frustrating for everyone and can really mess with the user experience.
That’s where full-stack observability comes in as a really helpful solution. It gives you a complete understanding of everything that’s going on in your application, so you can handle the complexity and fix issues much faster and easier. And guess what? OpenTelemetry is this cool, open way to collect all the information you need to get this full picture.
So, What’s the Deal with Full-Stack Observability?
Basically, full-stack observability is about keeping a close eye on everything in your application, from when a user interacts with it on their phone or computer, all the way down to the nuts and bolts of the computers it runs on. It’s like having a bird’s-eye view of your applications, whether they’re living in the cloud, on your own servers, or even in those fancy Kubernetes setups. But it’s not just about gathering data; the real magic is in getting useful insights that show you how all the different parts of your system connect and affect each other. It helps you really understand how things work together.
To get this full view, you need to collect and look at three main types of information, often called the three pillars of observability. Metrics are like taking measurements of how your system is doing over time, like how much of your computer’s brainpower (CPU) it’s using, how much memory it’s taking up, how long it takes for requests to go through, and how many errors are happening. These numbers help you see the overall health and resource usage of your system. Logs are like detailed diaries of everything that’s happening inside, with timestamps to show when things occurred. They give you the story of what happened at a specific moment. And then there are traces, which show you the whole journey of a request as it travels through all the different services in your system. This is super important these days because applications are often made up of lots of little services that talk to each other. Traces help you find bottlenecks and see the exact steps involved in fulfilling a user’s request.
Why bother with full-stack observability? Well, it’s got some pretty awesome benefits. You can spot and fix problems way faster because you can see how different parts of your system are interacting, which means less downtime. This complete view also helps you find those slow spots in your system and make things run smoother and more efficiently, leading to happier users. By catching potential problems early, you can keep your applications stable and reliable. Plus, when everyone – developers, operations folks, and security teams – can see the same picture, it makes communication and teamwork much better. And let’s not forget that by finding and fixing inefficiencies, you can actually save money on your operations.
There’s a big difference between old-school monitoring and full-stack observability. Traditional monitoring often focuses on just tracking certain things you already know about and setting up alerts for when those things go wrong. Observability, on the other hand, lets you ask and answer questions about what’s going on inside your system, even questions you didn’t think to ask beforehand. It lets you really dig into how your system behaves based on all the data you’re collecting. Also, to get true full-stack observability, you can’t just collect data in separate silos. You need to actively connect and analyze information from every part of your technology setup to get meaningful insights. By putting together the pieces of the puzzle from different areas, you can get a clear understanding of your overall performance and health, which helps you solve problems faster and more effectively.
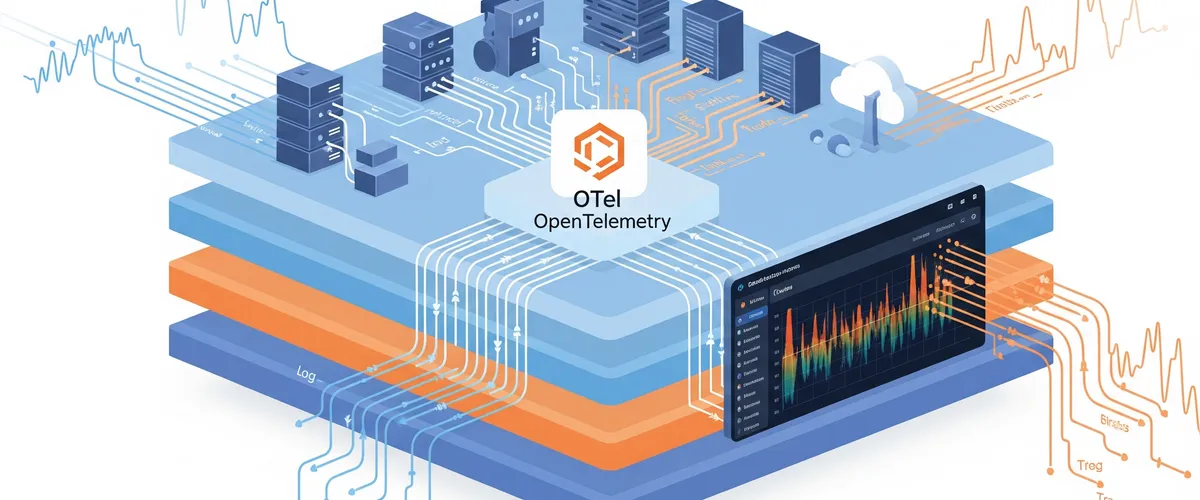
What’s OpenTelemetry and Why Should You Care?
OpenTelemetry, or OTel as it’s often called, is like this open-source project under the Cloud Native Computing Foundation (CNCF). It gives you a whole toolkit of things like instructions (APIs), ready-to-use code (SDKs), and tools to help you create, collect, and send out all that telemetry data – traces, metrics, and logs – from your applications and the computers they run on. In today’s world where distributed systems are everywhere, OpenTelemetry is super important because it gives you a standard, neutral way to collect this data. This makes it much simpler to see how requests move through all those interconnected services, giving you the end-to-end visibility you need to fix problems and make things run better. By showing you how your application is behaving while it’s running, OpenTelemetry helps developers and operations teams find slowdowns and figure out where errors are coming from more easily.
The OpenTelemetry project has a few key parts. It has specific instructions and code libraries for different programming languages (like Java, Python, and Go) that developers can use to make their code produce telemetry data. Then there’s the OpenTelemetry Protocol (OTLP), which is like a universal language for sending telemetry data efficiently between different parts of your system, no matter which company made them. It often uses things like gRPC or HTTP to do this. The Collector is like a central hub that can receive telemetry data from all sorts of places, process it if needed (like combining it, filtering it, or adding more information), and then send it off to one or more places where you can actually look at it. This central piece can also handle things like removing sensitive information and grouping data together to make sending it more efficient. Plus, there’s automatic instrumentation, which is really cool because it lets you collect telemetry data from common software without having to change your code much, making the whole process much easier.
There are some really good reasons why companies should think about using OpenTelemetry. Because it’s neutral, you’re not stuck with a specific monitoring company, giving you the freedom to choose the tools that work best for you, whether they’re free and open-source or you pay for them. This also means you’re not locked into one vendor. The fact that it standardizes all types of telemetry data makes setting things up and managing the data much simpler. Since it’s a project under the CNCF, OpenTelemetry has a big and active community of people working on it, which means it’s constantly being improved, it’s stable, and it’s likely to stick around for the long haul. It’s also designed to be flexible, so you can add support for your own custom data sources and backend systems. Ultimately, by giving you a consistent and complete way to collect telemetry data, OpenTelemetry makes it much easier for your organization to see what’s going on in your systems and get really useful insights.
OpenTelemetry came about because two earlier CNCF projects, OpenTracing and OpenCensus, joined forces. This shows that the industry realized how important it was to have a standard way of doing observability. Instead of having competing standards, they combined their efforts to create a stronger and more widely used framework. It’s important to remember that OpenTelemetry itself doesn’t store or show you the telemetry data. Its main job is to handle the initial steps of collecting and sending out that data. This separation gives you the advantage of picking the storage and analysis tools that best fit your needs and your current setup.
How Does OpenTelemetry Make Our Monitoring Better?
OpenTelemetry really steps up our monitoring game by giving us a standard way to collect metrics, logs, and traces from all sorts of different applications and services. This gets rid of the inconsistencies you often see when you’re using different tools or special agents for different parts of your system. This standardization even applies to how the telemetry data is named and formatted.
One of the big wins with OpenTelemetry is that it doesn’t tie you to a specific vendor. You’re no longer stuck with the special agents and data formats of one particular monitoring company. This freedom lets you choose the monitoring and observability tools that make the most sense for your unique situation, and you can even switch providers later on without having to completely redo your setup.
OpenTelemetry also makes it much easier to understand the context and connections between different pieces of telemetry data. By having a single framework for collecting traces, logs, and metrics, it helps you see how these different types of data relate to each other. This complete picture of how your system is behaving makes it much simpler to figure out the root cause of problems. Especially in distributed systems, OpenTelemetry’s context propagation makes sure that important information, like trace IDs, travels along with requests as they hop between services.
Setting up the instrumentation is also easier with OpenTelemetry. It offers automatic instrumentation for many popular software libraries and frameworks, which means you can collect telemetry data with much less manual coding. This saves developers time and lets them focus on building new features instead of getting bogged down in monitoring setup.
Furthermore, OpenTelemetry improves how different systems and platforms work together. Its standard protocols and data formats, including those APIs and SDKs, make it easy to share and analyze data across your entire infrastructure. This unified approach fills in the gaps in visibility in distributed systems by providing a common way to instrument all your services. This means you don’t have to re-instrument your code or install different special agents if you decide to change your backend platform.
Finally, because it’s a Cloud Native Computing Foundation project with a lively and active community, OpenTelemetry is designed to last. It’s constantly being updated and adapting to new technologies, making sure your observability setup stays relevant and effective over time, unlike those proprietary solutions that rely on vendors to build new integrations for everything. This commitment to standardization and vendor neutrality can also save organizations money by letting them use fewer monitoring tools and avoid the costs associated with proprietary solutions.
OpenTelemetry vs. Traditional Monitoring: What’s the Real Difference?
Traditional monitoring often focuses on specific parts of a system, like individual servers or application logs, which can give you a somewhat limited view of how everything is working together. It usually answers the question of “what” is happening in the system based on predefined metrics and alerts. A key thing about traditional monitoring tools is that they often use their own special agents and data formats, which can lock you into using that vendor.
OpenTelemetry, on the other hand, takes a much broader approach. It looks beyond just individual parts and emphasizes connecting the dots between telemetry data from the entire application stack to give you a much more complete understanding of how the system is behaving. This helps teams figure out the “why” behind system events and performance issues. As an open-source and vendor-neutral framework, OpenTelemetry offers a lot of flexibility and makes it easier for different systems and tools to work together. It collects not just metrics and logs, but also traces, in a standard way, which makes it much easier to connect these different types of data and get deeper insights into how your system is working.
When you think about how OpenTelemetry relates to traditional Application Performance Monitoring (APM) tools like New Relic, it’s important to understand what each one does. New Relic is a comprehensive, commercial platform that gives you end-to-end monitoring capabilities, with a strong focus on APM. In the past, it has relied on its own special agents to collect telemetry data. However, recognizing how important and widely used OpenTelemetry is becoming, New Relic now supports taking in telemetry data in the OpenTelemetry format (OTLP). This means that if you’ve set up your applications with OpenTelemetry, you can easily send your telemetry data to New Relic for more advanced analysis and visualization.
Using OpenTelemetry together with New Relic can be a really powerful combination. You get the flexibility and standardization of OpenTelemetry for collecting data, along with the strong analytics and visualization features of New Relic. OpenTelemetry can be especially useful for getting instrumentation in places where it might not be easy to deploy New Relic’s own agents. It’s worth noting, though, that while New Relic supports OpenTelemetry, some features might not work exactly the same as they do with New Relic’s own agents, and the way the data is structured might not always line up perfectly. Still, New Relic and other companies are increasingly embracing OpenTelemetry by supporting OTLP and actively contributing to the OpenTelemetry project. This shows a clear trend towards OpenTelemetry becoming a fundamental standard in the world of observability.
| Feature | Traditional Monitoring | OpenTelemetry |
|---|---|---|
| Scope | Focuses on specific parts, often isolated views | Covers the whole stack, connects data across everything |
| Question Answered | What went wrong? | Why did it go wrong? |
| Vendor Lock-in | Usually high | Low |
| Flexibility | Limited | High |
| Data Types | Mostly metrics and logs | Metrics, logs, and traces |
| Instrumentation | Often needs vendor-specific agents | Standard APIs/SDKs, automatic setup available |
| Cost | Can be expensive, especially with proprietary tools | Open-source framework, backend costs might apply |
While traditional APM tools like New Relic give you a smooth, ready-to-go experience, OpenTelemetry offers a more customizable way to set things up, which is really helpful for complex, cloud-based environments. Many organizations are now choosing to use both, with OpenTelemetry for collecting data and traditional APM tools for showing and analyzing it. Also, while traditional monitoring tools often have built-in ways to analyze data and detect problems, OpenTelemetry needs to be connected to separate backend tools for these things, giving you more choice in which analysis platform you want to use.
Getting Your Hands Dirty: OpenTelemetry in Action with Open Source Tools.
The real power of OpenTelemetry shines when you use it with other open-source tools in the observability world. Prometheus and Grafana are two such tools that, when you put them together with OpenTelemetry, create a strong and flexible observability solution.
Metrics with Prometheus: A Powerful Combination. Prometheus is a really popular open-source toolkit for monitoring and alerting, and it’s known for being great at collecting and storing metrics as time-series data. It works by periodically asking applications or special exporters for their metrics. OpenTelemetry can easily work with Prometheus by sending the metrics it collects in the format that Prometheus understands. You can do this using the Prometheus exporter that’s part of the OpenTelemetry Collector. The Collector acts like a middleman, getting metrics from applications that are set up with OpenTelemetry using the OTLP protocol, and then changing them into a format that Prometheus can easily use. Another cool thing is that Prometheus can now directly take in OpenTelemetry metrics using its OTLP receiver, which makes things even simpler.
To give you an idea of how this works, you’d usually set up the OpenTelemetry SDK in your application to send the metrics it collects to the OpenTelemetry Collector using OTLP. Then, you’d configure the Collector to use the Prometheus exporter, telling it the network address (like a website address and port number) where Prometheus can come and get the metrics. Finally, in the Prometheus settings, you’d define a job that tells it to go to that address on the OpenTelemetry Collector. This setup gives you the big advantage of being able to use Prometheus’s powerful query language, PromQL, and its smart alerting rules with the standardized and complete metrics that OpenTelemetry gathers. It’s good to know that the way OpenTelemetry and Prometheus name metrics might be a little different. However, the OpenTelemetry Collector often has ways to handle these differences and make the metric names consistent.
Visualizing Your Data with Grafana. Grafana is another really popular open-source platform that’s all about showing data in a visual way and monitoring things. It can work with lots of different data sources, and Prometheus is a very common one. Grafana lets you create really customizable and interactive dashboards to see your monitoring data. Once your OpenTelemetry metrics are stored in Prometheus (or your traces are in a backend like Jaeger or Tempo, and your logs are in Loki), you can set up Grafana to connect to these places. By adding Prometheus (or the right backend) as a data source in Grafana, you can then build dashboards to effectively visualize your OpenTelemetry data.
For metrics, Grafana lets you create different kinds of charts, like time-series charts to see how things like CPU usage or memory consumption change over time, heatmaps to analyze how long requests are taking, and histograms to understand the distribution of response times. If you’re using a tracing backend like Jaeger or Grafana Tempo with OpenTelemetry, Grafana can show you the flow of individual requests as they go through a distributed system, making it easier to find slow spots and latency issues. Similarly, for logs that OpenTelemetry collects and stores in Loki, Grafana has powerful tools for exploring and filtering logs, which helps you troubleshoot problems efficiently. The easy-to-use interface and the wide range of ways to visualize data in Grafana make it a really valuable tool for getting useful insights from your OpenTelemetry data, ultimately making it simpler to understand how your system is behaving and find areas that need attention.
Putting OpenTelemetry together for standardized data collection, Prometheus for storing and querying metrics reliably, and Grafana for versatile visualization and alerting gives you a complete and powerful open-source observability setup. These tools work well together, providing a flexible and cost-effective alternative to those paid observability platforms. What’s more, Grafana offers special integrations and versions, like Grafana Alloy, that are specifically designed to work smoothly with OpenTelemetry, making the setup and configuration process easier and showing how much support and maturity OpenTelemetry is gaining in the industry.
Conclusion
In a world where software systems are getting more complex, full-stack observability is becoming essential for organizations that want to keep their applications running smoothly. OpenTelemetry is a powerful tool that helps you collect and analyze telemetry data from all parts of your system, giving you the insights you need to understand how everything works together. By using OpenTelemetry with other open-source tools like Prometheus and Grafana, you can create a flexible and cost-effective observability solution that helps you spot and fix problems faster, leading to better performance and happier users.
This combination of OpenTelemetry, Prometheus, and Grafana not only simplifies the process of collecting and analyzing telemetry data but also allows you to visualize and understand your system’s behavior in a way that traditional monitoring tools can’t match. As the industry continues to embrace OpenTelemetry, it’s clear that this open-source framework is becoming a key player in the observability landscape, making it easier for organizations to achieve full-stack observability and improve their overall system performance.
By adopting OpenTelemetry and integrating it with your existing monitoring tools, you can take a big step towards achieving a complete view of your systems, making it easier to manage complexity and ensure the reliability of your applications.
References
- What Is Full Stack Observability? | Overview - NinjaOne, accessed on April 8, 2025, https://www.ninjaone.com/blog/what-is-full-stack-observability/
- Full-Stack Observability: What It Is [Minus the Fluff] - Last9, accessed on April 8, 2025, https://last9.io/blog/what-is-full-stack-observability/
- What is OpenTelemetry? - Elastic, accessed on April 8, 2025, https://www.elastic.co/what-is/opentelemetry
- What is OpenTelemetry? A Comprehensive Guide | Better Stack Community, accessed on April 8, 2025, https://betterstack.com/community/guides/observability/what-is-opentelemetry/
- OpenTelemetry: The key to modern enterprise observability - Elastic, accessed on April 8, 2025, https://www.elastic.co/blog/opentelemetry-native-observability-business-value
- OpenTelemetry vs. New Relic - Which Monitoring Tool Fits You? | SigNoz, accessed on April 8, 2025, https://signoz.io/comparisons/opentelemetry-vs-newrelic/
- Introduction to OpenTelemetry and New Relic, accessed on April 8, 2025, https://docs.newrelic.com/docs/opentelemetry/opentelemetry-introduction/
- Supercharge Your Node.js Monitoring with OpenTelemetry, Prometheus, and Grafana, accessed on April 8, 2025, https://dev.to/gleidsonleite/supercharge-your-nodejs-monitoring-with-opentelemetry-prometheus-and-grafana-4mhd
- Prometheus vs. OpenTelemetry Metrics: A Complete Guide - Timescale, accessed on April 8, 2025, https://www.timescale.com/blog/prometheus-vs-opentelemetry-metrics-a-complete-guide
- Integrating OpenTelemetry with Grafana for Better Observability - Last9, accessed on April 8, 2025, https://last9.io/blog/opentelemetry-with-grafana/
- Metrics Exporter - Prometheus - OpenTelemetry, accessed on April 8, 2025, https://opentelemetry.io/docs/specs/otel/metrics/sdk_exporters/prometheus/
- A practical guide to data collection with OpenTelemetry and Prometheus - Grafana, accessed on April 8, 2025, https://grafana.com/blog/2023/07/20/a-practical-guide-to-data-collection-with-opentelemetry-and-prometheus/
- The Complete Guide to OpenTelemetry and APM - Last9, accessed on April 8, 2025, https://last9.io/blog/opentelemetry-and-apm/
- Getting Started with OpenTelemetry [Frequently Asked Questions] - SigNoz, accessed on April 8, 2025, https://signoz.io/blog/getting-started-with-opentelemetry/