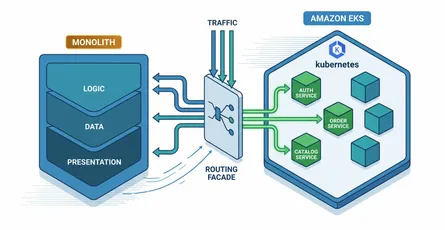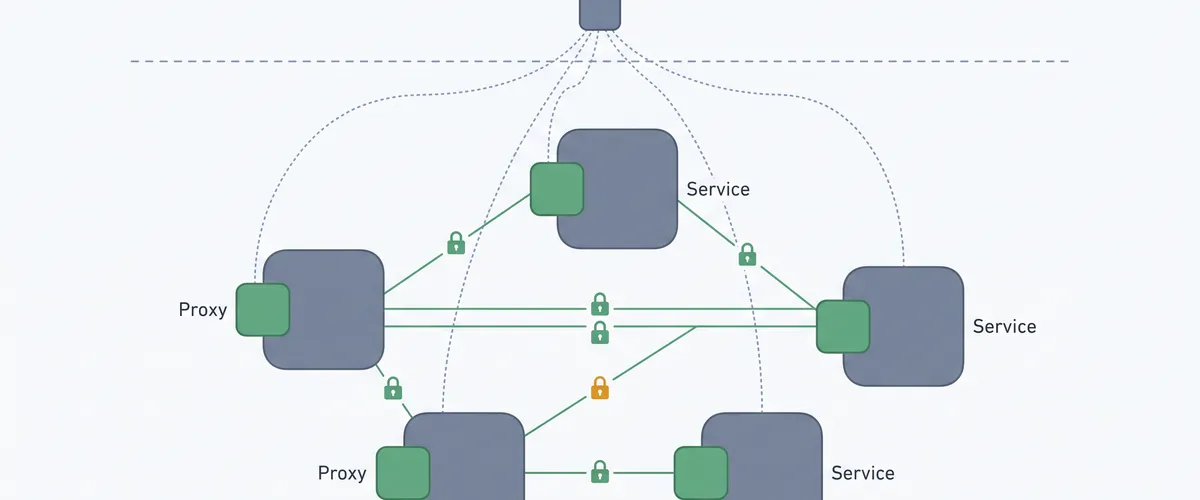
The request that started this was not “can we have a service mesh”. It was an auditor asking how we encrypted traffic between services, and the honest answer being that we mostly did not. Everything inside the VPC talked over plain HTTP, because that is what you get when a monolith becomes 34 services one extraction at a time and nobody stops to ask.
We rolled out Istio on EKS over four months. I think it was the right call, and I want to be specific about which part of it was right, because most of the reasons people give for a mesh did not apply to us.
The problem
Three things were true at once, and only the first was urgent.
Traffic between services was unencrypted. Not by decision, by accumulation. PCI-DSS applied to about a third of those services, and “the VPC is private” is not an answer anyone accepts twice.
Deploys were tense. We shipped roughly 40 times a week, and a canary meant running one replica of the new version and hoping the load balancer sent it a representative slice. With 4 replicas that is 25% of traffic, which is not a canary, it is a coin flip.
And when something got slower, finding out which hop was slower took a day. Each team had instrumented their own service differently, or not at all, so the answer usually arrived after the incident had resolved itself.
We spent two hours establishing that the latency was not in the service everyone thought it was in.
Constraints
No application changes. We had 34 services across two languages and six teams, and any plan that required all of them to adopt a library at the same time was not a plan.
No new failure domain in the request path that we could not reason about. The platform team was three people.
And the rollout had to be incremental, service by service, with a working mixed state. A big-bang cutover across six teams was not something anyone would have approved.
Architecture
A mesh is two things, and keeping them straight is most of understanding it.
The control plane is istiod. It watches the Kubernetes API, issues a short-lived certificate per workload identity, and pushes configuration to every proxy. It is not in the request path, which is the single most reassuring fact about the architecture: if istiod dies, existing traffic keeps flowing with the last configuration it received.
The data plane is an Envoy sidecar injected into every pod. This is the part that costs. Your app container talks plain HTTP to localhost, the sidecar wraps it in mTLS, and the receiving sidecar unwraps it before handing it to that app on localhost. Neither application knows any of this happened, which is exactly why we could adopt it without touching 34 codebases.
Note
The “no application changes” property is doing enormous work here, and it is worth being precise about why. The sidecar intercepts traffic with iptables rules installed by an init container, so it captures connections the application already makes. Nothing is imported, nothing is configured in code, and a service written before the mesh existed gets mTLS the moment its pod restarts.
Rolling it out without a big bang
Istio’s namespace-level injection made an incremental rollout straightforward, and PERMISSIVE mode made it safe:
# Accept both mTLS and plain text while the estate is half migrated.apiVersion: security.istio.io/v1kind: PeerAuthenticationmetadata: name: default namespace: istio-systemspec: mtls: mode: PERMISSIVEA meshed service can then talk to an unmeshed one and vice versa, so the order of migration stops mattering. We ran PERMISSIVE for eleven weeks. Flipping to STRICT at the end was a one-line change and, because we had checked the telemetry first, a non-event.
The check that made it a non-event:
# Any plain-text traffic still arriving? If this returns nothing for a week,# STRICT is safe. We ran it daily and only flipped when it had been empty# for five consecutive days.kubectl exec -n istio-system deploy/istiod -- \  pilot-agent request GET /debug/config_dump | \  jq -r '.. | .transportSocketMatches? // empty'
# The blunter version, from the metrics:#   istio_requests_total{connection_security_policy="none"}
Implementation
-
Install the control plane and mesh nothing. Istio running with zero injected namespaces changes no behaviour and lets you learn the operator, the CRDs, and the upgrade path with no blast radius.
-
Mesh one low-traffic internal service, in
PERMISSIVE. Ours was an internal reporting API with two consumers and no customer path. This is where you find out that your readiness probes needholdApplicationUntilProxyStarts, and it is much better to find that out on a reporting API. -
Mesh a team at a time, not a service at a time. Namespace-level injection means the unit is the namespace anyway, and a team migrating together can answer each other’s questions instead of asking you.
-
Turn on telemetry and leave it alone for a fortnight. The golden signals arrive whether you asked for them or not, and having two weeks of baseline before you start shifting traffic is what makes the first canary readable.
-
Introduce traffic shifting only after the mesh is boring. We waited until the last namespace was migrated. Doing this in the middle would have mixed “the canary is bad” with “the mesh is misconfigured” during exactly the window where we could not tell them apart.
-
Flip to
STRICT, after the plain-text metric has been zero for a week.
The traffic shifting itself is the part people expect to be complicated and is not:
apiVersion: networking.istio.io/v1kind: VirtualServicemetadata: name: paymentsspec: hosts: ['payments'] http: - route: - destination: {host: payments, subset: v1} weight: 95 - destination: {host: payments, subset: v2} weight: 5Five percent means five percent, regardless of how many replicas are behind each subset. That is the whole difference from a replica-count canary, and at 40 deploys a week it is worth a great deal.
Careful here
The gap between a VirtualService and a DestinationRule caused every one of our early self-inflicted outages. The VirtualService says “send 5% to subset v2”. The DestinationRule is what defines what v2 means. Apply the first without the second and every request routed to the undefined subset fails, with an error that names the destination service. So the alert fires on payments, the on-call engineer pages the payments team, and the payments team correctly reports that they are fine. Apply the DestinationRule first, always.
Results
Measured over the six weeks before the rollout and the six weeks after the last namespace was migrated, at comparable traffic.
| What | Before | After | Note |
|---|---|---|---|
| Service-to-service traffic encrypted | roughly 15% | 100% | measured from connection_security_policy |
| Time to identify a slow hop | hours, sometimes a day | minutes | measured against four incidents after |
| Canary granularity | 25%, one replica of four | 1% | configuration, not arithmetic |
| Deploys reverted after a canary caught something | not measurable before | 7 in six weeks | these are the ones that did not become incidents |
| Added latency, p50 | baseline | +0.9 ms | measured |
| Added latency, p99 | baseline | +4 ms | measured |
| Memory, per pod | baseline | +90 MB | measured, and the real cost |
| Cluster nodes | 18 | 22 | consequence of the line above |
Seven caught regressions in six weeks is the number I would lead with if I had to justify this again. Each of those is a deploy that reached 1% of users, misbehaved, and was withdrawn before it reached the rest.
Four extra nodes is what that cost, plus the sidecars themselves.
Lessons
The compliance requirement carried the entire business case. Everything else was a bonus we would not have paid for on its own. I want to be blunt about this because “we should adopt a mesh for observability” is a conversation I have now been in twice, and both times a shared library would have been cheaper.
Not having an owner nearly sank it. We rolled out a new component in the request path of every service with no one whose job description mentioned it. For three months the mesh was on the platform team’s list somewhere below everything with a deadline, and it went un-upgraded through two releases. A mesh with no owner becomes the thing every team blames when something is slow and nobody has the standing to change.
Sidecar memory is the cost that surprises people, not latency. Everyone asks about latency, and the honest answer is that 4 ms at p99 is inside the noise of a normal week. Nobody asks about the 90 MB, and 90 MB times 340 pods is four more nodes.
A mesh upgrade is a full estate restart. The sidecar version is part of the pod spec, so upgrading the mesh means every pod in it restarts. This is fine and it is also not what “patch release” suggests, and it needs to be on the change calendar rather than discovered.
Two places for retries is worse than one. We already had retries and timeouts in application code. Adding them at the mesh layer meant that during one incident a request was being retried three times by the sidecar and twice by the caller, turning a slow dependency into a hammered one. We removed the mesh-level retries and kept the code. If we had been greenfield, the reverse would have been the right choice.
Frequently Asked Questions
Below roughly ten services, no. An ALB with TLS between components, plus a shared library for retries and tracing, gets most of the benefit for one process per pod instead of two. The mesh starts paying for itself when the number of service-to-service edges is large enough that configuring them individually stops being tractable, and that happened for us somewhere north of twenty services.
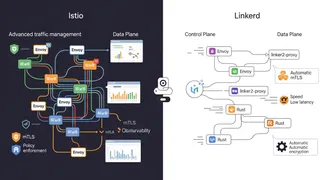
Linkerd was the closer call and would have been a reasonable choice: it is meaningfully lighter and simpler to run. We went with Istio because we needed fine-grained authorization policy that Linkerd did not cover at the time, and because the AWS integration for certificates was better documented. If our requirement had been mTLS alone, Linkerd’s smaller footprint would probably have won.
A good part of the memory cost, in principle. Sidecar-less modes move the layer-4 work to a per-node component and only add a proxy where layer-7 features are actually used, which would have cut the per-pod overhead substantially. We started before it was something I was willing to run in a PCI environment. On a project starting today I would evaluate it seriously, and I would still want the layer-7 features on the services doing traffic shifting.
Two, both self-inflicted and both configuration rather than software. One was the DestinationRule ordering described above. The other was a PeerAuthentication scoped to the wrong namespace, which enforced strict mTLS against a service whose caller was not yet meshed. Neither was Envoy failing; both were us telling it something we did not mean.
Nothing, and that is deliberate. Developers run services directly, with no mesh, talking over plain HTTP. Because the mesh is transparent to application code there is nothing to stub. The cost is that mesh-level policy is only exercised from the first shared environment onward, so a VirtualService mistake cannot be caught on a laptop.
The metrics are: request rate, error rate and latency per service, per version, with no instrumentation. Distributed tracing is not. The sidecar will propagate trace headers, but only if the application forwards the incoming headers to its outbound calls, and that is a code change in every service. We got the golden signals for nothing and spent a sprint on header propagation for the traces.
References
- Istio: architecture and the control and data planes
- Istio: mutual TLS and PeerAuthentication
- Istio: traffic shifting with VirtualService and DestinationRule
- Istio: ambient mode, the sidecar-less data plane
- Envoy proxy documentation
- Amazon EKS best practices for networking
- AWS Private Certificate Authority, for issuing the mesh trust chain
- Linkerd, for the comparison