The incident that started this was not caused by carelessness. It was caused by someone being careful.
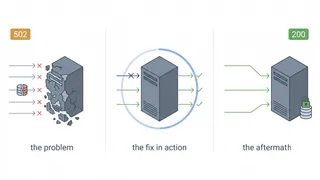
A release went out at 14:20 on a Tuesday. Error rate climbed within ninety seconds. The on-call engineer saw the alert, opened the dashboard, checked whether it was a blip, decided it was not, found the previous image tag, and rolled back. Total time from deploy to recovery: five minutes and ten seconds.
Every step in that sequence was correct. Nobody panicked, nobody guessed, nobody skipped a check. And for five minutes, every single user got 500s, because our deploy process had exactly one setting: all of them, now.
Impact
Twenty-seven services moved from all-at-once deployments to canary releases with automated analysis against live metrics. The rollback stopped being a runbook step performed by a person and became a state transition performed by a controller, which took it from minutes to under a minute without anyone deciding anything.
The number that mattered internally was not the rollback time. It was the share of users who saw a bad release at all. Under the old process that was everyone, every time. Under the new one a failed release reaches roughly one user in twenty for about a minute. The figures below were measured on our own systems over the fourteen-week rollout and the quarter that followed, so read them as the shape to expect rather than a promise.
That last figure needs a caveat we insisted on internally. Change failure rate fell partly because failures were caught before reaching everyone, and partly because the analysis step made people write metrics they had not previously bothered with. Some of the improvement is better deployment and some of it is better observability, and we could not cleanly separate the two.
The problem
We had a deploy process, and it was fine, in the way that a process is fine right up until the moment you measure what it costs.
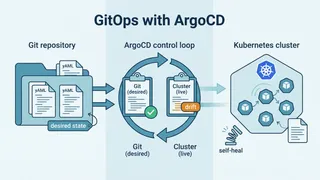
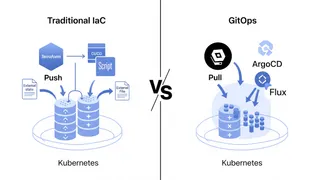
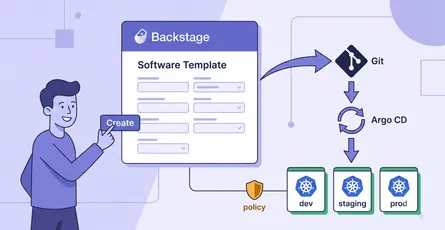
Every service was a standard Kubernetes Deployment with a RollingUpdate strategy. ArgoCD synced from Git, the deployment rolled pods over about ninety seconds, and if something was wrong you found out from an alert and reverted the commit. Reverting was reliable and slow, because reliability came from a human confirming it was warranted.
Three properties of that setup produced most of our incidents.
Directoryplatform/ - apps/ - checkout/ - deployment.yaml - service.yaml - hpa.yaml - orders/ - deployment.yaml - search/ - deployment.yaml - argocd/ - applications/ - checkout.yaml - orders.yaml - README.md
- …
A RollingUpdate is not a safety mechanism. It replaces pods gradually, which people read as gradual exposure. It is not. Once the first new pod is Ready, the Service load balances across old and new indiscriminately, so a share of traffic hits the new version immediately and that share grows regardless of whether the new version is healthy. Readiness probes catch a pod that failed to start. They say nothing about a pod that starts perfectly and returns the wrong answer.
The rollback decision was the slow part, not the rollback. kubectl rollout undo is fast. Deciding to run it is not. The engineer has to distinguish a real regression from ordinary variance, which means opening a dashboard and looking at a graph, which takes as long as it takes.
Nobody wanted to deploy on a Friday. That is a soft cost that turns into a hard one. Work batched up over the weekend, Monday releases were larger, and larger releases fail more often, which reinforced the fear that produced them.
Careful here
The trap in this kind of project is treating deployment speed as the goal. It is not. Our deploys got slower, deliberately: a canary release takes about twelve minutes against ninety seconds before. What improved was the cost of being wrong, and that is the only number that justified the work.
Constraints
We were not starting from a clean sheet, and three constraints shaped every decision.
- No coordinated migration. Twenty-seven services owned by six teams. Anything requiring all of them to change at once was not going to happen, so the migration had to be per service and reversible per service.
- GitOps stays authoritative. ArgoCD already reconciled everything from Git. Any tool that needed an imperative
promotestep run by a human against a cluster would have punched a hole in the audit trail we had spent a year building. - Prometheus is what we have. No budget for a new observability platform, and no appetite for one. Whatever made the promotion decision had to make it from metrics that already existed, or from metrics a team could add in an afternoon.
A fourth constraint emerged during the pilot and turned out to matter more than the first three. Several services had no useful per-version metrics at all. They reported aggregate error rate for the service, with no label distinguishing which pods served which request, which makes canary analysis impossible in principle rather than in practice.
Architecture
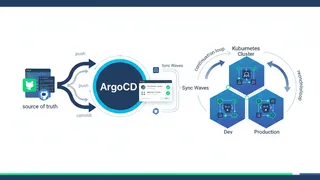
Argo Rollouts replaces the Deployment resource with a Rollout resource that has the same pod template and a strategy that can pause, measure and decide. The controller manages two ReplicaSets and shifts traffic between them by manipulating the service selectors, or by writing to an ingress or service mesh when one is present.
We considered blue-green first, because it is simpler and Argo Rollouts supports both. We rejected it for a specific reason.
Blue-green runs the new version alongside the old at full capacity, then switches 100% of traffic at once. It makes rollback instant, which is genuinely valuable. It does nothing about blast radius, because when the switch happens every user is on the new version. A bad release still reaches everyone; it just reaches them for less time.
Tip
Blue-green is the right choice when a version boundary must be clean, most commonly when two versions cannot safely share a database schema or a queue at the same time. If your release can tolerate two versions running concurrently, canary gives you strictly more safety for the same tooling. If it cannot, canary is not available to you regardless of preference.
The other half of the architecture is the analysis. An AnalysisTemplate defines metric queries and success conditions, and the Rollout references it at each step. The controller runs the queries, evaluates the conditions, and either proceeds or aborts.
Implementation
The Rollout resource
The migration from a Deployment was mostly mechanical. Same spec.template, different kind, plus a strategy block.
apiVersion: argoproj.io/v1alpha1kind: Rolloutmetadata: name: checkoutspec: replicas: 12 revisionHistoryLimit: 3 selector: matchLabels: app: checkout template: metadata: labels: app: checkout spec: containers: - name: checkout image: registry.internal/checkout:v2.14.0 ports: - containerPort: 8080 readinessProbe: httpGet: {path: /healthz/ready, port: 8080} periodSeconds: 5 strategy: canary: canaryService: checkout-canary stableService: checkout-stable trafficRouting: nginx: stableIngress: checkout analysis: templates: - templateName: canary-health startingStep: 1 args: - name: service-name value: checkout steps: - setWeight: 5 - pause: {duration: 5m} - setWeight: 25 - pause: {duration: 5m} - setWeight: 50 - pause: {duration: 3m} - setWeight: 100Three details in there took us longer than they should have.
startingStep: 1 means the analysis begins after the first weight change rather than immediately, which avoids an analysis run against a canary that has no traffic yet. revisionHistoryLimit: 3 matters more than usual here, because an abort needs the previous ReplicaSet to still exist. And the two Services are required: Argo Rollouts manages their selectors itself, so they must exist and must not be managed by anyone else.
The analysis, which is where the actual thinking is
This is the part that determines whether the whole exercise is worth anything.
apiVersion: argoproj.io/v1alpha1kind: AnalysisTemplatemetadata: name: canary-healthspec: args: - name: service-name metrics: - name: error-rate-vs-stable interval: 60s count: 5 # Two consecutive failures abort. One is usually noise. failureLimit: 1 consecutiveErrorLimit: 2 provider: prometheus: address: http://prometheus.monitoring:9090 query: | sum(rate(http_requests_total{ service="{{args.service-name}}", version="canary", code=~"5.." }[2m])) / sum(rate(http_requests_total{ service="{{args.service-name}}", version="canary" }[2m])) # Compared against the stable version over the same window, not # against a fixed number. The baseline moves with reality. successCondition: >- result[0] <= 1.5 * (sum(rate(http_requests_total{service="{{args.service-name}}", version="stable", code=~"5.."}[2m])) / sum(rate(http_requests_total{service="{{args.service-name}}", version="stable"}[2m])) + 0.001)
- name: p99-latency-vs-stable interval: 60s count: 5 failureLimit: 1 provider: prometheus: address: http://prometheus.monitoring:9090 query: | histogram_quantile(0.99, sum by (le) ( rate(http_request_duration_seconds_bucket{ service="{{args.service-name}}", version="canary" }[2m]) )) successCondition: result[0] <= 1.3 * {{args.stable-p99}}
- name: minimum-traffic interval: 60s count: 5 failureLimit: 0 provider: prometheus: address: http://prometheus.monitoring:9090 query: | sum(rate(http_requests_total{ service="{{args.service-name}}", version="canary" }[2m])) * 120 # Below this, the other two metrics are measuring noise. successCondition: result[0] >= 200That third metric was added in week nine and is the one we would keep if we could only keep one.
Our first version measured error rate for thirty seconds at 5% weight. On a service handling forty requests a second, that is sixty requests in the canary. Sixty requests cannot distinguish a 0.5% error rate from a 2% one, so the analysis passed on statistical noise and we shipped two regressions through a canary that had approved them. The minimum-traffic metric turns “we did not observe a problem” into “we observed enough to have a view”, and it fails the analysis when the sample is too small rather than passing it.
The + 0.001 in the first success condition is similarly unglamorous and similarly load-bearing. Without it, a stable error rate of exactly zero makes the threshold zero, so a single 500 in the canary aborts the release. Adding a small floor means the comparison is “meaningfully worse than stable” rather than “not literally perfect”.
Note
Both version="canary" and version="stable" labels have to come from somewhere. Argo Rollouts injects a rollouts-pod-template-hash label, and we relabelled it in the Prometheus scrape config. Getting this wrong is the most common reason an analysis silently compares a version against itself and passes everything.
Wiring it into GitOps
The constraint that ArgoCD stays authoritative shaped this more than anything else. Argo Rollouts is designed for it, and there was one sharp edge.
apiVersion: argoproj.io/v1alpha1kind: Applicationmetadata: name: checkoutspec: project: platform source: targetRevision: main path: apps/checkout destination: server: https://kubernetes.default.svc namespace: checkout syncPolicy: automated: prune: true selfHeal: true ignoreDifferences: # Argo Rollouts owns these selectors and rewrites them during a # rollout. Without this, selfHeal fights the rollout controller # and the canary flaps between weights. - group: '' kind: Service jsonPointers: - /spec/selector# Fully automatic: every step gated by analysis, no human in the path.steps: - setWeight: 5 - pause: {duration: 5m} - setWeight: 50 - pause: {duration: 5m} - setWeight: 100
# Manual gate: pause indefinitely until someone promotes.# We used this for the first two weeks of each service's migration.steps: - setWeight: 5 - pause: {} # requires: kubectl argo rollouts promote checkout - setWeight: 50 - pause: {duration: 5m} - setWeight: 100apiVersion: v1kind: ConfigMapmetadata: name: argo-rollouts-notification-configmapdata: trigger.on-rollout-aborted: | - when: rollout.status.abort == true send: [rollout-aborted] template.rollout-aborted: | slack: attachments: | [{ "title": "Canary aborted: {{.rollout.metadata.name}}", "color": "#dc2626", "fields": [ {"title": "Revision", "value": "{{.rollout.status.currentPodHash}}"}, {"title": "Reason", "value": "analysis run failed"} ] }]That ignoreDifferences block is the sharp edge. ArgoCD with selfHeal: true sees the Service selector that Argo Rollouts just rewrote, decides it has drifted from Git, and rewrites it back. The two controllers then fight, and the canary oscillates between weights while the rollout never completes. It presents as a mysterious flapping deploy and the fix is four lines.
The abort path
An abort is a state transition, not a command.
Nothing scaled down and nothing restarted. The stable ReplicaSet was still running at full capacity the whole time, so aborting is a selector change and traffic returns to the version that was already serving it. That is why the median is forty-one seconds rather than the time it takes to schedule pods.
Results
Fourteen weeks, six teams, twenty-seven services. We migrated in waves of three or four, and we deliberately started with a mid-traffic service rather than the least important one, because the least important service has too little traffic for canary analysis to work and would have taught us nothing.
Controller and one pilot service
Installed Argo Rollouts, migrated search with a manual promotion gate. Discovered immediately that our Prometheus metrics had no version label, which blocked everything until we fixed the scrape config.
The analysis template, three rewrites
First version compared against a fixed 1% error threshold and fired at 3am when normal variance crossed it. Second compared against stable and passed on 60 requests of noise. Third added the minimum-traffic metric.
Ten services, manual gates
Every rollout paused for a human promotion. Teams watched the analysis agree with them roughly forty times before anyone was willing to remove the gate.
Automatic promotion, and the ArgoCD fight
Removed manual gates on services with two weeks of clean history. Spent three days on a flapping canary before finding that selfHeal was reverting the Service selector.
The long tail
Seven low-traffic services could not produce a meaningful canary sample. They stayed on blue-green, which gives fast rollback without pretending to do analysis.
Change failure rate over the following quarter fell 68%, from 11.2% of deploys causing a user-visible regression to 3.6%. Deploy frequency rose about 40%, which we did not plan for and which is the clearest evidence that the fear of Friday deploys was a real constraint rather than a cultural quirk.
The individual deploy got slower, from ninety seconds to about twelve minutes. Nobody complained, because a deploy that nobody has to watch takes zero minutes of anyone’s attention regardless of how long it runs.
Seven services never made it onto canary. Their traffic is low enough that a 5% slice over five minutes is a few dozen requests, and no amount of configuration makes that statistically meaningful. Putting them on canary would have produced an analysis that always passes, which is worse than no analysis because it looks like one.
Lessons
The thing that changed my mind was not the rollback time. It was watching the analysis abort a release I would have shipped. I had looked at the same dashboard and decided the error rate was fine. It was not fine, it was 1.4 times stable, and I could not see that by looking because I did not have stable on the same graph.
Compare against the incumbent, never against a constant. This is the single most important thing we learned and it cost us two weeks. A fixed threshold is wrong in both directions: it fires overnight when low traffic makes normal variance look extreme, and it stays quiet at peak when a genuine regression is still under the number. The stable version, measured over the same window, is the only baseline that moves with reality.
A canary with too little traffic is worse than no canary. It produces a green tick that means nothing, and people trust it. Measure the sample size explicitly and fail the analysis when it is too small, rather than letting the other metrics quietly assess noise.
The migration was blocked on observability, not on the tool. Argo Rollouts took an afternoon to install. Getting every service to emit metrics labelled by version took most of the first three weeks, and it was the actual project. If your services cannot distinguish their own versions in Prometheus, you do not have a deployment problem to solve yet.
Worth knowing
Run manual promotion gates for longer than feels necessary. Teams removed theirs after watching the analysis agree with their own judgement roughly forty times. That is not a technical requirement, and skipping it would have meant automating a decision nobody yet trusted, which is how you get a team that quietly stops deploying.
Progressive delivery only catches what is visible in minutes. Three failures got through in the following quarter and every one of them was outside what a canary can see. A memory leak that took four hours to matter. A migration that was fine at 5% write volume and locked the table at 100%. A bug affecting only accounts created before a 2021 schema change, which is under 2% of users and never landed in the canary slice at all. Narrowing blast radius is real and it is not a substitute for testing.
Frequently Asked Questions
We were already running ArgoCD, and Argo Rollouts shares its notification engine, its CLI conventions and its dashboard. Flagger is a genuinely good tool with a different design: it wraps an existing Deployment rather than replacing it, which some teams prefer because the migration is less invasive. If you run Flux rather than ArgoCD, Flagger is the more natural fit and none of the lessons here change.
No, and we do not run one. Argo Rollouts can shape traffic through an ingress controller, and the NGINX and ALB integrations were enough for us. Without either, it falls back to splitting by replica count, which works and is coarse: a 5% weight needs twenty replicas to express. A mesh gives you precise weights and per-request routing, and it is a large thing to adopt for this benefit alone.
Nothing dramatic, because nothing is terminated. The stable ReplicaSet is running at full capacity throughout, so an abort changes which pods the Service selects. Requests already in flight to canary pods complete normally, and the canary pods scale down afterwards with the usual grace period. This is why the abort is fast and why it is safe.
Carefully, and mostly by not letting the two interact. Every migration has to be backwards compatible with the previous version, because both versions run simultaneously for twelve minutes. That means the expand-migrate-contract pattern: add the column, deploy code that writes both, backfill, deploy code that reads the new one, then drop the old one in a later release. A migration that cannot be made backwards compatible is the case where blue-green is the correct answer instead.
Probably not. The value scales with deploy frequency, and the setup cost is fixed: version-labelled metrics, an analysis template, and a period of watching it agree with you before you trust it. For a service that deploys monthly, blue-green gives you fast rollback for far less work. We kept seven services there deliberately.
Very little directly. The controller is one small deployment, and the canary ReplicaSet is extra pods only for the duration of a rollout, which for us averaged twelve minutes. The real cost was engineering time in the first three weeks fixing metrics, and it would have been higher if we had needed to adopt a service mesh.
Almost. The one change would be starting with the Prometheus labelling work before installing anything, because it blocked the pilot for most of two weeks and we had treated it as a detail. Everything else, the mid-traffic pilot, the long manual-gate period, and accepting that low-traffic services stay on blue-green, we would repeat.