Linux Processes
A reference for managing Linux processes and services. Covers ps and top for inspection, kill and pkill for signals, nice and renice for priority, cgroups and limits, and systemctl and journalctl for managing and debugging systemd units.
Most of what you need day to day is inspecting what is running, sending it the right signal, and reading why it stopped. The reference below covers those in order, but two ideas are worth internalising because they change your diagnosis rather than just your command.
The first is the state column. A process at 100% CPU in R state and one stuck in D state look similar in a monitoring dashboard and require completely different responses. R is a code problem. D is almost always a storage problem, and no amount of kill -9 will help, because a process blocked in an uninterruptible syscall cannot receive signals at all.
The second is that on any modern distribution you are usually not managing processes, you are managing systemd units. Killing a supervised process by PID looks like a crash to systemd, which dutifully restarts it, and you conclude the kill did not work. systemctl stop and systemctl kill exist so that the supervisor knows what you meant.
That distinction gets sharper on a fleet, where you rarely have SSH access to the host that is misbehaving.
The commands in the reference work the same whether you reached the host through SSH, Session Manager, or kubectl exec. What changes is how you get there and how much of it you can do to a hundred hosts at once.
No commands found
Try adjusting your search term
Inspecting Processes
Finding out what is running, what it is doing, and what it costs.
ps, the reliable one
A snapshot of the process table. Scriptable, unlike top.
The two portable invocations
Both list all processes. `aux` shows %CPU and %MEM, `-ef` shows the parent PID (PPID), which is what you want when tracing who spawned what.
# BSD style: everything, with user and terminalps aux
# UNIX style: everything, full command lineps -ef- Note there is no dash in `ps aux`. Adding one changes the meaning.
Custom columns, sorted, the triage command
`-eo` gives you exactly the columns you need in a stable order, which makes the output safe to parse. Sorting by `-pcpu` puts the problem first.
# Top CPU consumers with the state columnps -eo pid,ppid,stat,pcpu,pmem,rss,etime,comm --sort=-pcpu | head -15
# Top memory consumers, RSS in human termsps -eo pid,rss,comm --sort=-rss | head -15 | awk 'NR==1{print;next}{printf "%-8s %8.1f MB %s\n", $1, $2/1024, $3}'ps -eo pid,stat,pcpu,rss,comm --sort=-pcpu | head -5PID STAT %CPU RSS COMMAND1843 Rl 182.0 2451328 java9021 S 4.1 198432 postgres712 Ssl 1.8 84120 containerd1122 S 0.9 42188 sshd- RSS is in kilobytes and counts shared pages once per process, so summing it across processes over-counts.
- `etime` is elapsed wall time, useful for spotting a process that should have exited hours ago.
Finding a PID without grepping ps
`pgrep` avoids the classic bug where `ps aux | grep foo` also matches the grep process itself.
pgrep -f 'java.*api-server' # match the full command linepgrep -u deploy nginx # only this user's nginxpgrep -l -f celery # list PID and namepgrep -c sshd # just count them- `-f` matches against the whole command line, not just the executable name. Without it, `pgrep java.*api` never matches.
Reading the STAT column
The single most useful field, and the one most often skipped.
What each state means
D and Z are the two that change your diagnosis completely: a D-state process is blocked in the kernel and cannot be killed, and a zombie is already dead.
R running or runnable (on CPU, or waiting for one)S interruptible sleep (waiting for an event, can be signalled)D uninterruptible sleep (in a syscall, usually blocked on I/O)T stopped (by SIGSTOP/SIGTSTP, or by a debugger)Z zombie (exited, exit status not yet collected by the parent)I idle kernel thread
suffixes:< high priority N low priority (nice > 0)s session leader l multi-threaded+ in the foreground process groupHunting D-state (blocked) processes
`wchan` names the kernel function the process is sleeping in. A cluster of D-state processes almost always means a storage problem: a failing disk, a hung NFS mount, or a saturated volume.
# Anything stuck uninterruptibleps -eo pid,stat,wchan:25,comm | awk '$2 ~ /^D/'
# What kernel function is it waiting in?sudo cat /proc/1843/stack
# Which file is it blocked on?sudo ls -l /proc/1843/fd | tail- You cannot kill a D-state process. Not with -9, not with anything. Fix the I/O or reboot.
Zombies and who is responsible
A zombie holds only a PID slot, no memory or CPU. It exists because the parent never called `wait()`. Killing the zombie is meaningless; it has already exited.
# List zombies with their parentps -eo pid,ppid,stat,comm | awk '$3 ~ /Z/'
# The parent is the bug. Ask it to reap:kill -CHLD <PPID>
# If the parent is broken, kill the parent. init adopts and reaps.kill <PPID>- A handful of zombies is harmless. Thousands will exhaust the PID space and stop new processes from starting.
top and friends, live view
Interactive inspection when you need to watch behaviour over seconds.
top, the keys worth knowing
Press `1` first on a multi-core box. A process showing 400% CPU is using four cores, which is fine, or four cores spinning, which is not.
top
#  1  toggle per-CPU lines        H  show individual threads#  M  sort by memory              P  sort by CPU#  c  full command line           k  kill a PID#  e  cycle memory units         W  save your config to ~/.toprc#  o  filter, e.g. COMMAND=java
Watching one process, not the whole system
`top -H` splits a process into threads, which is how you find the one runaway thread inside an otherwise healthy JVM.
top -H -p 1843 # per-thread view of one PIDpidstat -p 1843 1 5 # CPU breakdown, 1s interval, 5 samplespidstat -d -p 1843 1 # its disk I/O- `pidstat` comes from the `sysstat` package and separates user time from system time, which `top` blends together.
Signals and Termination
Asking a process to stop, and the difference between asking and forcing.
kill, pkill, killall
Sending signals to one process or many.
The signals you will actually use
SIGTERM lets the process run its shutdown handler, flush buffers, release locks, and remove its pidfile. SIGKILL is delivered by the kernel and gives it no chance to do any of that.
kill 1843 # SIGTERM (15), the default. Polite, catchable.kill -TERM 1843 # same thing, explicitkill -HUP 1843 # SIGHUP (1), conventionally "reload config"kill -QUIT 1843 # SIGQUIT (3), quit + core dump (JVM: thread dump)kill -KILL 1843 # SIGKILL (9), last resort. Cannot be caught.kill -STOP 1843 # freezekill -CONT 1843 # resumekill -USR1 1843 # app-defined (nginx: reopen logs)- `kill -l` lists every signal name and number on your system.
The right escalation
`kill -0` sends no signal; it just tests whether you could. That makes it the correct way to poll for "has it exited yet".
# Ask, wait, then insist.kill -TERM "$PID"for _ in $(seq 1 15); do kill -0 "$PID" 2>/dev/null || { echo "exited cleanly"; exit 0; } sleep 1doneecho "still alive after 15s, forcing"kill -KILL "$PID"- Straight to `-9` is the habit worth breaking. It is why you find stale lock files and half-written data.
Killing by name and pattern
`pkill -f` matches against the whole command line, which is the only way to distinguish two `python` processes running different scripts.
pkill nginx                    # by exact process namepkill -f 'python.*worker.py'   # by full command linepkill -u deploy                # everything owned by a userpkill -e -f celery             # -e echoes what it killed
killall -TERM nginx # by name; different arg stylekillall -w nginx # wait for them to actually die- Always test the pattern with `pgrep -f` before running `pkill -f`. `pkill -f python` will happily kill your own tooling.
Trapping signals in scripts
Making your own scripts shut down cleanly.
Clean up on exit, however it happens
A single `EXIT` trap for cleanup plus an `INT TERM` trap for the message is the pattern that covers every exit path, including `set -e` failures.
#!/usr/bin/env bashset -euo pipefail
workdir=$(mktemp -d)# EXIT fires on normal exit AND after INT/TERM handlers run,# so one trap covers every path out of the script.trap 'rm -rf "$workdir"' EXITtrap 'echo "interrupted, shutting down"; exit 130' INT TERM
do_work_in "$workdir"- You cannot trap SIGKILL or SIGSTOP. If your cleanup must survive that, it belongs in a separate reaper, not a trap.
Priority and Limits
Controlling how much CPU, memory, and I/O a process may take.
nice and renice
CPU scheduling priority, from -20 (greedy) to 19 (polite).
Starting and changing priority
Positive nice values are polite and any user can set them. Negative values are greedy and require root. `ionice` is the disk equivalent and is often the one that actually helps, since batch jobs are usually I/O bound rather than CPU bound.
nice -n 19 ./batch-job.sh        # start it as low priorityrenice -n 10 -p 1843            # lower an existing processsudo renice -n -5 -p 1843       # raise it (needs root)renice -n 15 -u backup          # every process of a user
ionice -c 3 -p 1843 # idle I/O class: only when disk is freeionice -c 2 -n 7 ./rsync-job # best-effort, lowest priority- Unprivileged users can only ever *increase* niceness. You cannot undo your own `nice -n 19`.
- nice affects CPU only. A niced process can still saturate your disk; that is what `ionice` is for.
ulimit and cgroups
Hard ceilings, per shell or per service.
Per-shell limits with ulimit
`ulimit` applies to the current shell and anything it spawns. It does not retroactively affect a running service.
ulimit -a # everything, current shellulimit -n # max open file descriptorsulimit -u # max user processesulimit -n 65535 # raise the soft limit (up to the hard limit)ulimit -Hn # show the hard limit- For services, `ulimit` in a shell profile is ignored. Set `LimitNOFILE=` in the systemd unit instead.
Real ceilings with cgroups v2, via systemd
cgroups are the only enforcement that actually holds. `CPUQuota=150%` means one and a half cores, and `MemoryMax` triggers the OOM killer inside the cgroup rather than taking down the host.
# Cap a running service without editing filessudo systemctl set-property api.service MemoryMax=2G CPUQuota=150%
# Run an ad-hoc command inside a limited scopesudo systemd-run --scope -p MemoryMax=512M -p CPUQuota=50% ./import.sh
# What is this unit actually consuming?systemctl status api.service | grep -E 'Memory|CPU|Tasks'cat /sys/fs/cgroup/system.slice/api.service/memory.current- `MemoryHigh=` throttles under pressure; `MemoryMax=` is a hard wall that kills. Prefer High plus a generous Max.
systemd Services
On any modern distribution, most long-running processes are units, and you manage them through systemd rather than by PID.
systemctl
Start, stop, inspect, and enable units.
Daily commands
`enable` and `start` are independent. Forgetting `enable` is why a service that works today is missing after a reboot.
systemctl status api.service        # state, PID, recent logssystemctl start|stop|restart api    # .service is impliedsystemctl reload api                # re-read config, no restartsystemctl reload-or-restart api     # reload if supported, else restart
systemctl enable api # start at bootsystemctl enable --now api # enable AND start right nowsystemctl disable api # do not start at bootsystemctl mask api # make it impossible to startsystemctl unmask api- `mask` symlinks the unit to /dev/null. It is the only way to stop something another unit keeps pulling in.
Finding and understanding units
`systemctl cat` shows the unit plus every drop-in override in one view, which is what you want before wondering why a setting is not taking effect.
systemctl list-units --type=service --state=runningsystemctl list-units --failed              # what is brokensystemctl list-unit-files --state=enabled  # what starts at boot
systemctl cat api.service # the effective unit filesystemctl show api.service -p Restart -p ExecStartsystemctl list-dependencies api.service- Never edit files in `/lib/systemd/system` directly. Use `systemctl edit api` to create a drop-in under `/etc/systemd/system/api.service.d/`.
Signals through systemd
Prefer this over `kill` for anything systemd supervises, because a plain `kill` looks like a crash and triggers the `Restart=` policy.
systemctl kill api.service # SIGTERM to the main processsystemctl kill --signal=SIGQUIT api.service # a specific signalsystemctl kill --kill-whom=all --signal=SIGKILL api.servicejournalctl
Reading the logs, which is where the actual reason lives.
The queries that answer real questions
`-p err` and `--since` together cut a wall of logs down to the few lines that matter. `-b -1` is how you read what happened before an unexpected reboot.
journalctl -u api.service -n 100 # last 100 lines for one unitjournalctl -u api.service -f # follow, like tail -fjournalctl -u api.service --since "10 min ago"journalctl -u api.service -p err # errors and worse onlyjournalctl -u api.service -b -1 # from the PREVIOUS bootjournalctl -k # kernel messages onlyjournalctl _PID=1843 # by PIDjournalctl -u api --since today -o json-pretty | jq .MESSAGE- Priorities run 0 (emerg) to 7 (debug). `-p warning` includes warning, err, crit, alert and emerg.
Keeping the journal from eating the disk
A journal with no cap will happily grow until the root filesystem is full, which then breaks everything else in confusing ways.
journalctl --disk-usagesudo journalctl --vacuum-size=500M     # trim to a sizesudo journalctl --vacuum-time=14d      # trim by age
# Permanent, in /etc/systemd/journald.conf:#   SystemMaxUse=1G#   MaxRetentionSec=1month
Was this useful?
Continue on this topic
The same subject, covered a different way from the cheatsheet above.
 Flashcards
Linux Foundation Certified System Administrator Flashcards (LFCS)
Spaced-repetition deck for the LFCS exam: essential commands, users and groups, storage, networking, services, and security.
 Quiz
QuizLinux: System Administration Fundamentals
Test your knowledge of Linux fundamentals with a quiz covering essential commands, file system navigation, permissions, process management, package managers, and Linux administration best practices.
 Article
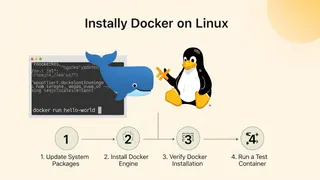
How To Install Docker On Linux In 4 Easy Steps
A step-by-step guide to installing Docker on Linux in 4 steps, from updating the package index to running your first Docker container.
 Code snippet
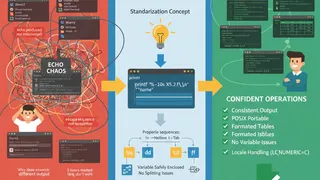
Why printf Beats echo in Linux Scripts
Why printf is more reliable than echo for output in Linux scripts. The portability problems with echo, what printf gives you instead, and when each command is the right choice.
You might also enjoy
More posts on similar topics
Cron
- Mohammad Abu Mattar
- Terminal
- System Administration
- Linux
- Scheduling
- Automation
- Tools
Quick reference Field layout Min Hour Day Month Weekday Command* /path/to/command ┬ ┬ ┬ ┬ ┬ │ │ │ │ └───── Weekday (0=Sunday,
Netstat
- Mohammad Abu Mattar
- Terminal
- System Administration
- Linux
- Networking
- Tools
This netstat cheatsheet covers six categories, with worked examples and troubleshooting steps in each.
AWK
- Mohammad Abu Mattar
- Terminal
- Text Processing
- Linux
- Command Line
- Development Tools
- Scripting
AWK complete reference guide Quick start Print entire file awk '{ print }' file.txt# Print specific column awk '{ print $1 }' file.txt# Print lines matching pattern awk '/patter
Bash
- Mohammad Abu Mattar
- Scripting
- Shell
- Linux
- Unix
- Command Line
- Automation
Bash is a Unix shell and command language written by Brian Fox for the GNU Project as a free software replacement for the Bourne shell. The sections below cover Bash commands, syntax, and examples.
Chmod
- Mohammad Abu Mattar
- Terminal
- Programming
- Linux
- File Management
- Tools
Complete chmod reference covering file permissions, recursive changes with -v and -c, reference mode, logical operators, batch operations, practical examples, and security best practices for Linux fil
Find
- Mohammad Abu Mattar
- Terminal
- Programming
- Linux
- File Operations
- Tools
Best practices for find command usageAlways quote patterns to prevent shell expansion of special characters Use -type f first in find expressions for optimal performance **Prune hea
6 related posts