Need to optimize slow PostgreSQL queries? Here’s how with EXPLAIN ANALYZE and strategic indexing.
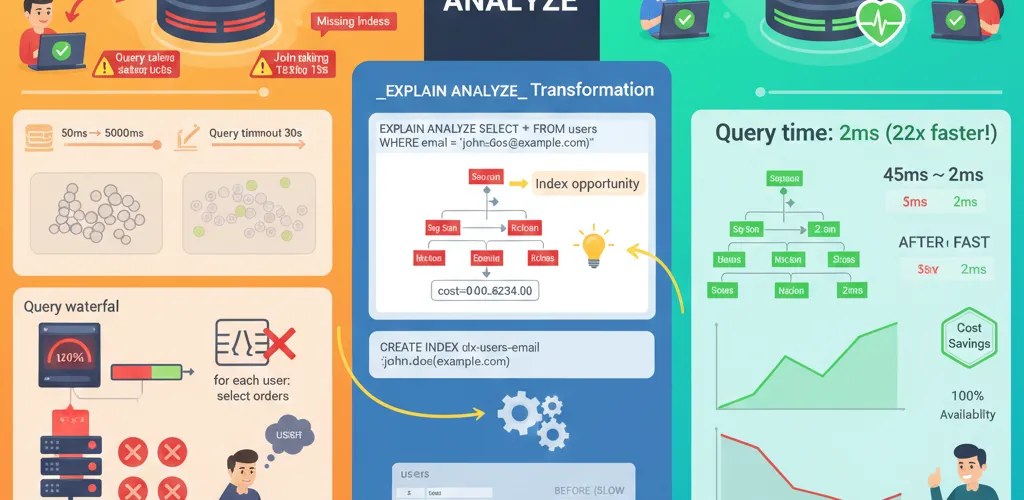
Slow database queries kill application performance. But most developers don’t know where the actual bottleneck is, so they guess at fixes. EXPLAIN ANALYZE reveals exactly what’s expensive and where to optimize.
The Problem
Why Queries Get Slow
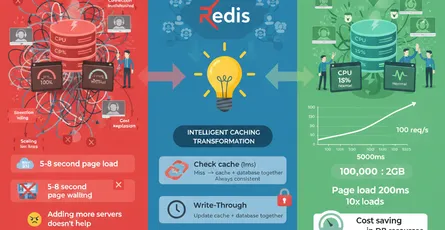
In development with small datasets, missing indexes don’t matter. Switch to production with millions of rows, and suddenly sequential table scans become devastating. Queries that ran in 50ms take 5+ seconds. You need to know why.
Common Performance Issues
- Missing indexes: Forcing full table scans on every query
- N+1 queries: Fetching data in loops instead of bulk operations
- Bad query plans: Using inefficient joins or sorts
- Undersized indices: Index on wrong columns
- Connection pool exhaustion: Running out of available connections
The Solution
EXPLAIN ANALYZE: Your Debugging Superpower
EXPLAIN ANALYZE shows exactly how PostgreSQL executes your query, including:
- Which operations are most expensive (by cost)
- Actual vs. estimated row counts
- Time spent in each step
- Seq Scans vs. Index Scans
- Sort and Hash operations
TL;DR
- Run EXPLAIN ANALYZE to identify expensive operations
- Add indexes where sequential scans happen on large tables
- Use pg_stat_statements to automatically find slow queries
- Fix N+1 query patterns before rewriting complex queries
- Setup connection pooling for better resource utilization
Understanding EXPLAIN ANALYZE
Basic Query Analysis
-- Compare these two queriesEXPLAIN ANALYZESELECT * FROM users WHERE created_at > '2025-01-01';
-- Output example:-- Seq Scan on users (cost=0.00..35.50 rows=1000 width=100)-- Filter: (created_at > '2025-01-01')-- Planning Time: 0.123 ms-- Execution Time: 45.234 msWhat this tells you:
Seq Scan: Reading entire table (slow for large tables)cost=0.00..35.50: PostgreSQL’s estimated costrows=1000: Expected to return 1000 rowsExecution Time: 45.234 ms: Actual time taken
Reading the Cost
EXPLAIN ANALYZESELECT u.id, u.name, o.totalFROM users uLEFT JOIN orders o ON u.id = o.user_idWHERE u.status = 'active';
-- Output:-- Hash Left Join (cost=2534.50..5892.33 rows=5000 width=50)-- Hash Cond: (o.user_id = u.id)-- -> Seq Scan on orders o (cost=0.00..1234.50 rows=50000 width=8)-- -> Hash (cost=2500.00..2500.00 rows=5000 width=42)-- -> Index Scan using idx_users_status on users u (cost=10.00..2500.00 rows=5000 width=42)Cost interpretation:
- Lower cost = faster execution
cost=A..B: A = startup cost, B = total cost- Focus on the highest-cost operations first
Creating Effective Indexes
Basic Index Creation
-- Simple B-tree index (most common)CREATE INDEX idx_users_email ON users(email);
-- Multi-column indexCREATE INDEX idx_orders_user_date ON orders(user_id, created_at);
-- Partial index (only index active users)CREATE INDEX idx_users_active ON users(id) WHERE status = 'active';
-- Unique index (constraint + performance)CREATE UNIQUE INDEX idx_users_email_unique ON users(email);Index Types: When to Use Each
-- B-tree (default, best for most queries)CREATE INDEX idx_standard ON table_name(column);
-- Hash (equality only, rarely faster than B-tree)CREATE INDEX idx_hash ON table_name USING hash(column);
-- GiST (geometric, full-text search)CREATE INDEX idx_fulltext ON articles USING gist(search_vector);
-- GIN (array, JSON, full-text - faster for large result sets)CREATE INDEX idx_json ON logs USING gin(metadata);Partial Indexes for Common Cases
-- Don't index inactive recordsCREATE INDEX idx_active_orders ON orders(id) WHERE status != 'cancelled';
-- Only index recent dataCREATE INDEX idx_recent_events ON events(id) WHERE created_at > NOW() - INTERVAL '90 days';
-- Saves space and speeds up queries on active dataMulti-Column Index Strategy
-- For WHERE + ORDER BY combinations-- Query: WHERE user_id = ? ORDER BY created_at DESCCREATE INDEX idx_user_date ON orders(user_id, created_at DESC);
-- Column order matters: Put filtered columns first-- Good: WHERE status = ? AND type = ?CREATE INDEX idx_good ON events(status, type);
-- Bad: WHERE status = ? AND type = ?CREATE INDEX idx_bad ON events(type, status); -- Wrong orderDetecting and Fixing N+1 Queries
The N+1 Problem
# BAD: N+1 queries (1 + N queries)users = db.query(User).all() # Query 1for user in users: orders = db.query(Order).filter(Order.user_id == user.id).all() # Queries 2 to N+1 print(f"{user.name}: {len(orders)} orders")
# Result with 1000 users = 1001 queriesThe Fix: Eager Loading
# GOOD: Eager load with joinfrom sqlalchemy import joinedload
users = db.query(User).options(joinedload(User.orders)).all() # Single query with join
for user in users: print(f"{user.name}: {len(user.orders)} orders")SQL Equivalent
-- BAD (N+1):SELECT * FROM users; -- 1000 queries...SELECT * FROM orders WHERE user_id = ?;
-- GOOD (Single query):SELECT u.id, u.name, o.id, o.totalFROM users uLEFT JOIN orders o ON u.id = o.user_id;Finding Slow Queries Automatically
Enable Query Logging
-- Enable logging of slow queries (500ms+)ALTER SYSTEM SET log_min_duration_statement = 500;SELECT pg_reload_conf();
-- View current settingSHOW log_min_duration_statement;Use pg_stat_statements
-- Install extensionCREATE EXTENSION IF NOT EXISTS pg_stat_statements;
-- Find slowest queriesSELECT query, calls, mean_time, max_timeFROM pg_stat_statementsORDER BY mean_time DESCLIMIT 10;
-- Find queries that were called mostSELECT query, calls, mean_timeFROM pg_stat_statementsORDER BY calls DESCLIMIT 10;
-- Clear stats to get fresh baselineSELECT pg_stat_statements_reset();Query Optimization Patterns
Pattern 1: Missing Index on WHERE Clause
-- Before: Seq Scan (slow)EXPLAIN ANALYZESELECT * FROM orders WHERE customer_id = 42;
-- Fix: Add indexCREATE INDEX idx_orders_customer ON orders(customer_id);
-- After: Index Scan (fast)EXPLAIN ANALYZESELECT * FROM orders WHERE customer_id = 42;Pattern 2: Inefficient Subqueries
-- SLOW: Subquery evaluated for each rowSELECT * FROM ordersWHERE customer_id IN ( SELECT id FROM customers WHERE status = 'premium');
-- FAST: Use JOIN insteadSELECT DISTINCT o.*FROM orders oJOIN customers c ON o.customer_id = c.idWHERE c.status = 'premium';Pattern 3: Using Functions in WHERE Clauses
-- SLOW: Function applied to indexed column
-- FAST: Use expression indexCREATE INDEX idx_users_email_lower ON users(LOWER(email));
-- OR: Normalize incoming data insteadPattern 4: Missing ORDER BY Index
-- SLOW: Sort step requiredEXPLAIN ANALYZESELECT * FROM events ORDER BY created_at DESC LIMIT 10;
-- Fix: Add index for sortCREATE INDEX idx_events_date_desc ON events(created_at DESC);
-- Now uses Index Scan + Limit, no Sort stepConnection Pooling
Why Connection Pooling Matters
-- Without pooling: Each request opens/closes connection (expensive)-- With pooling: Reuse existing connections (cheap)PgBouncer Configuration
[databases]myapp = host=localhost port=5432 dbname=myapp_prod
[pgbouncer]listen_port = 6432listen_addr = 127.0.0.1auth_type = md5auth_file = /etc/pgbouncer/userlist.txt
# Connection pooling settingspool_mode = transactionmax_client_conn = 1000default_pool_size = 25min_pool_size = 10reserve_pool_size = 5reserve_pool_timeout = 3Application Connection
# Before pooling: Direct to PostgreSQLimport psycopg2conn = psycopg2.connect("dbname=myapp user=postgres host=localhost")
# After pooling: Connect to PgBouncer on port 6432import psycopg2conn = psycopg2.connect("dbname=myapp user=postgres host=localhost port=6432")Real-World Optimization Workflow
Step 1: Identify the Slow Query
# From application logs or pg_stat_statements# Example: SELECT query is taking 8000msStep 2: Run EXPLAIN ANALYZE
EXPLAIN ANALYZESELECT o.id, o.total, c.nameFROM orders oJOIN customers c ON o.customer_id = c.idWHERE o.created_at > '2025-01-01'ORDER BY o.total DESC;Step 3: Look for Expensive Operations
Sort (cost=9234.50..9244.50) ← Look here -> Hash Join (cost=2500.00..9234.00) ← And here -> Seq Scan on orders o (cost=0.00..5000.00) ← Sequential scan on large table -> Hash (cost=100.00..100.00 rows=1000) -> Seq Scan on customers c (cost=0.00..100.00)Step 4: Add Indexes
-- Index for WHERE clauseCREATE INDEX idx_orders_date ON orders(created_at);
-- Index for JOIN conditionCREATE INDEX idx_orders_customer_id ON orders(customer_id);
-- Index for ORDER BYCREATE INDEX idx_orders_total ON orders(total DESC);Step 5: Rerun EXPLAIN ANALYZE
-- Should now use Index Scans instead of Seq Scans-- No Sort step if you have the right indexBest Practices
1. Index Naming Convention
-- Consistent naming helps find related indexesCREATE INDEX idx_table_column_type ON table_name(column);
-- Examples:CREATE INDEX idx_users_email ON users(email);CREATE INDEX idx_orders_customer_date ON orders(customer_id, created_at);CREATE INDEX idx_products_active ON products(id) WHERE active = true;2. Monitor Index Usage
-- Find unused indexes (bloat)SELECT schemaname, tablename, indexnameFROM pg_indexesWHERE schemaname NOT IN ('pg_catalog', 'information_schema');
-- Check if index is being usedSELECT indexrelname, idx_scan, idx_tup_read, idx_tup_fetchFROM pg_stat_user_indexesORDER BY idx_scan DESC;3. Regular Maintenance
-- Analyze table stats (for query planner)ANALYZE users;
-- Vacuum to clean up dead rowsVACUUM FULL users;
-- Reindex if fragmented (heavy write workloads)REINDEX INDEX idx_users_email;