Summary
The complaint that started this was not about speed. It was a support ticket saying the dashboard “sometimes doesn’t load”, from a customer whose account was roughly forty times larger than our median account. Our latency dashboard showed a p50 of 90ms and a green tick, so for about three weeks nobody believed them.
They were right, and our monitoring was lying by omission.
Impact
- A real customer, on one of our largest accounts, intermittently unable to load their dashboard for about three weeks.
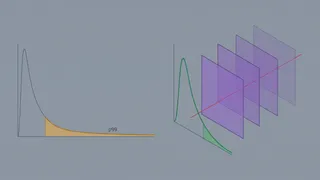
- The p99 sat at 4.2 seconds against a p50 of 90ms. That 46x spread is not a uniformly slow system; it is a small class of requests doing something completely different from the rest.
- On the account that complained, the largest-account p99 reached 9.8 seconds.
- Large-account requests thrashed Aurora’s buffer pool, so they slowed everyone else down too.
Timeline
No dated clock survives. The shape of the three weeks does:
- A support ticket arrives: the dashboard “sometimes doesn’t load”.
- The p50 dashboard shows green, and for about three weeks the ticket loses to the graph every time it is looked at.
- Someone finally slices by percentile and account. The p99 is 4.2s, and on the complaining account the endpoint runs its join 214 times and takes just over four seconds.
From our own postmortem, three weeks in: “We spent the first sprint optimising the wrong thing, because the p50 said the system was fine and the p50 is what the dashboard showed by default.”
Root cause
The offender was GET /api/v1/projects, which built each row from a
nine-table join covering the project, its owner, its current status, its
two most recent activity entries, and a permissions check. On an account
with three projects it ran the join three times and returned in 60ms. On
the account that complained it ran 214 times.
The join included a correlated subquery against the activity table, which had grown past 400 million rows, so its cost scaled with account age rather than account size.
Contributing factors
The dashboard defaulted to p50. The median of a bimodal distribution describes neither mode. Three weeks of disbelief came from one default.
Cache keys were built wrong before they were built right. The first caching implementation keyed on the incoming request, including a header the load balancer sets per request. Hit ratio zero, Redis full of single-use entries, and a 4% “improvement” that was noise. It took two weeks and a colleague asking why key cardinality exceeded the user count to catch it.
KEYS in production. The first invalidation implementation used
KEYS project:*, which blocks Redis while it scans every key. It worked
in staging with 400 keys and caused a 900ms stall in production with 2
million.
What changed
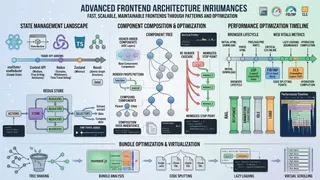
The full rearchitecture is the case study: CDN and Redis layers in front of the join, with measured before-and-after numbers. The incident-specific changes:
- Percentile and account-size slicing in the dashboards, so a large-account tail cannot hide inside a green median again.
- Key cardinality tracked against expected cardinality as a dashboard panel; it would have caught the cache-key bug on day one.
- A hard rule from the incident review: no change could increase the blast radius of an Aurora failover.
- No pattern-based deletion anywhere,
SCAN-based invalidation from a centralised key map instead, because every early staleness bug was a write path that forgot one of the three keys it should have touched.
Did it hold
Measured four weeks before and after at comparable traffic: p99 4.2s to 1.6s, largest-account p99 9.8s to 2.1s, Aurora read IOPS down 71%. The caveat the review made us write down: caching moved the failure mode, it did not remove it. Two of three post-rollout incidents were correctness bugs, and neither triggered a latency alert, because both were fast.
What I would do differently
Put the tail on the dashboard before a customer has to put it in a ticket. The p50 default was not a monitoring decision; it was a default.
The full rearchitecture, including the stale-on-error design that turned an Aurora failover into slightly old data, is written up in A p99 Latency Caching Rearcitecture.