A slow pipeline does not just waste compute. It changes behaviour. Once feedback takes longer than about ten minutes, people stop waiting for it. They context-switch, batch up changes into bigger pull requests, and start merging on optimism. The cost shows up later as harder debugging, not as a line on your CI bill.
The tips below are in the order I would actually apply them, which is not the order they usually get applied. Measurement first, then eliminating work, then parallelising what remains, and only then caching. Most teams do this backwards and start with caching because it feels like the obvious knob.
Tip 1: measure before you touch anything
You cannot optimise what you have not timed. Every CI system exposes per-step duration somewhere, and almost nobody looks at it before making changes.
# GitHub Actions: average duration per step across the last 20 runsgh run list --workflow ci.yml --limit 20 --json databaseId --jq '.[].databaseId' \ | while read -r id; do gh api "repos/:owner/:repo/actions/runs/$id/jobs" \ --jq '.jobs[] | .steps[] | select(.completed_at != null) | [.name, ((.completed_at | fromdateiso8601) - (.started_at | fromdateiso8601)) ] | @tsv' done \ | awk -F'\t' '{sum[$1]+=$2; n[$1]++} END {for (s in sum) printf "%6.1fs avg %3d runs %s\n", sum[s]/n[s], n[s], s}' \ | sort -rnThe output usually surprises people. A pipeline everyone describes as “slow because of tests” turns out to spend nine minutes on a Docker build and four on tests.
Tip
Track the p90, not the mean. CI duration is bimodal: cache hit versus cache miss, warm runner versus cold. A mean of 8 minutes can hide a p90 of 22, and the p90 is what people actually feel.
Tip 2: do not build what cannot have broken
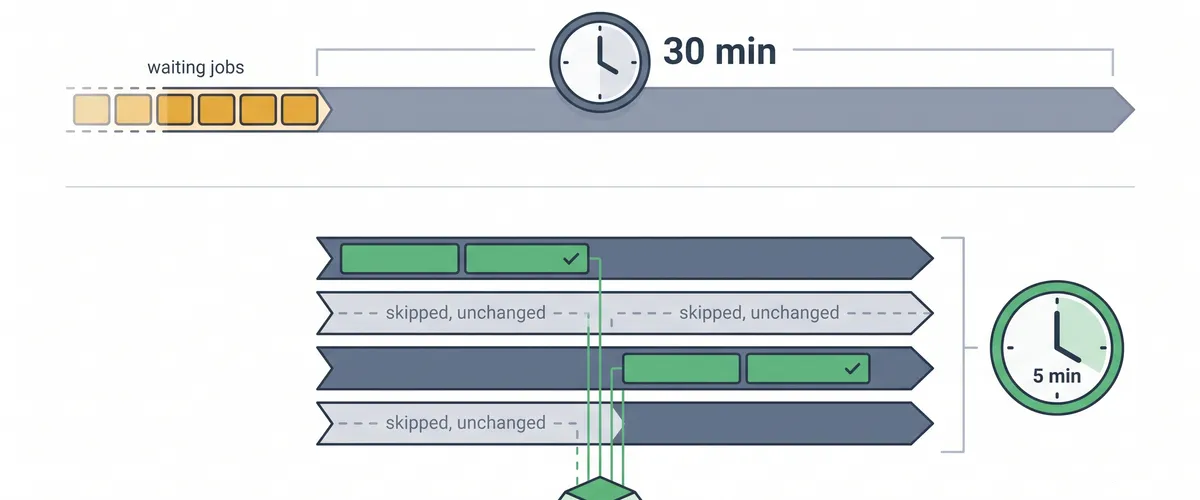
In a monorepo this is the single biggest win available, and it beats caching by a wide margin. If the change touched only services/billing, there is no reason to test services/search.
jobs: changes: runs-on: ubuntu-latest outputs: services: ${{ steps.filter.outputs.changes }} steps: - uses: actions/checkout@v4 - uses: dorny/paths-filter@v3 id: filter with: # A change to shared/ or the lockfile invalidates everything, so it # is listed under every service. Forgetting this is how you ship a # broken shared library with a green pipeline. filters: | billing: - 'services/billing/**' - 'shared/**' - 'pnpm-lock.yaml' search: - 'services/search/**' - 'shared/**' - 'pnpm-lock.yaml' web: - 'apps/web/**' - 'shared/**' - 'pnpm-lock.yaml'
test: needs: changes if: needs.changes.outputs.services != '[]' strategy: fail-fast: false matrix: service: ${{ fromJSON(needs.changes.outputs.services) }} runs-on: ubuntu-latest steps: - uses: actions/checkout@v4 - run: pnpm --filter "./services/${{ matrix.service }}" testCareful here
If a required status check is skipped, branch protection can block the merge forever waiting for a check that will never report. Either mark the job as required only when it runs, or add a final aggregate job that always runs and reports success when its dependencies were skipped.
For monorepos with a real dependency graph, let the build tool work out what is affected instead of maintaining path filters by hand:
# Everything affected by this branch's changes, and nothing elsepnpm nx affected --target=test --base=origin/main --head=HEAD
# See the graph it derived before trusting itpnpm nx show projects --affected --base=origin/main# --filter with a git range resolves dependents automaticallypnpm turbo run test --filter='...[origin/main]'# Query the targets whose inputs changed, then test exactly thosebazel query "rdeps(//..., set($(git diff --name-only origin/main)))" \ --output=label | xargs bazel testTip 3: shard tests by measured time, not alphabetically
Splitting a suite into four equal counts of files gives four very unequal durations. One shard finishes in 40 seconds and another takes 6 minutes, and your wall clock is 6 minutes. Balance on recorded timings instead.
// scripts/shard.mjs - split spec files into N shards of similar duration.// Reads timings from a previous run's JSON report; falls back to file size.import {readFileSync} from 'node:fs';import {globSync} from 'node:fs';
const shardCount = Number(process.argv[2] ?? 4);const shardIndex = Number(process.argv[3] ?? 0);
let timings = {};try { timings = JSON.parse(readFileSync('.ci/test-timings.json', 'utf8'));} catch { // First run, or the artifact expired. Size is a rough proxy.}
const files = globSync('src/**/*.test.js') .map((f) => ({f, cost: timings[f] ?? readFileSync(f).length / 1000})) .sort((a, b) => b.cost - a.cost); // longest first
// Greedy bin packing: always add the next longest to the lightest shard.const shards = Array.from({length: shardCount}, () => ({cost: 0, files: []}));for (const item of files) { const lightest = shards.reduce((a, b) => (a.cost <= b.cost ? a : b)); lightest.files.push(item.f); lightest.cost += item.cost;}
process.stdout.write(shards[shardIndex].files.join('\n'));Greedy longest-first bin packing is not optimal, but it lands within a few percent of balanced and takes ten lines. The upgrade path is a real solver, and you will not need it.
Note
Sharding only helps if the shards are genuinely independent. Suites that share a database, a fixed port, or a filesystem path will pass alone and fail in parallel. Fix the isolation before adding shards, or you will spend the savings debugging flakes.
Tip 4: cache keys that actually hit
A cache that misses every run costs you the save time and gives nothing back. The key must change when the dependencies change and not otherwise.
- uses: actions/cache@v4 with: path: | ~/.local/share/pnpm/store node_modules/.cache # Exact key: same lockfile, same OS, same Node major. key: deps-${{ runner.os }}-node20-${{ hashFiles('pnpm-lock.yaml') }} # Fallback: a slightly stale store still saves most of the download. restore-keys: | deps-${{ runner.os }}-node20- deps-${{ runner.os }}-Three rules that cover most cache mistakes:
- Hash the lockfile, never
package.json.package.jsonsays^4.2.0and does not change when the resolved version does. - Always provide
restore-keys. A partial hit that needs to fetch three new packages beats a cold miss that fetches nine hundred. - Never cache the output of the thing you are testing. Caching
dist/across commits means you eventually test a stale build and cannot reproduce it locally.
For container builds, the cache lives in the registry rather than the CI cache:
# BuildKit inline cache: the pushed image carries its own layer metadata,# so the next build on a cold runner can still reuse layers.docker buildx build \ --cache-from "type=registry,ref=$ECR_REPO:buildcache" \ --cache-to "type=registry,ref=$ECR_REPO:buildcache,mode=max" \ --tag "$ECR_REPO:$GIT_SHA" \ --push .mode=max stores intermediate layers too, not just the final ones. It makes the cache bigger and hits far more often, which is the trade you want.
Tip 5: build once, reuse everywhere
A pipeline that compiles in the lint job, again in the test job, and again in the package job is paying three times for one result. Build once and pass it forward.
build: runs-on: ubuntu-latest steps: - uses: actions/checkout@v4 - run: pnpm install --frozen-lockfile && pnpm build - uses: actions/upload-artifact@v4 with: name: dist-${{ github.sha }} path: dist/ retention-days: 1 # CI artifacts are not backups
test: needs: build runs-on: ubuntu-latest steps: - uses: actions/checkout@v4 - uses: actions/download-artifact@v4 with: name: dist-${{ github.sha }} path: dist/ - run: pnpm test:integration # runs against dist/, does not rebuildThis also removes a class of bug where the artifact you tested is not the artifact you shipped, because now there is only one artifact.
Putting it together
The shape matters more than the specific services. Decide what to build, fan out over only that, share a cache across the fan-out, and join at the end. The same topology maps cleanly onto GitHub Actions, GitLab CI, or Buildkite.
What order to actually do this in
- Instrument. Get per-step durations for the last 20 runs and find the p90. Do nothing else until you have this.
- Delete. Look for steps that no longer earn their time: a linter that duplicates a pre-commit hook, a coverage upload nobody reads, a matrix entry for a runtime you dropped last year.
- Skip. Add change detection. In a monorepo this is usually a bigger win than everything below it combined.
- Parallelise the top item. Shard the single slowest job. Do not shard everything; you will pay setup cost per shard for jobs that were never the problem.
- Cache the second item. Now that the biggest cost is gone, caching has something to bite on.
- Re-measure. Optimisation moves the bottleneck rather than removing it, so the list is different now. Stop when the p90 is under your team’s tolerance, not when the config is beautiful.
Careful here
Beware of optimisations that trade correctness for speed. Skipping tests on main, reusing a cached test result across a dependency bump, or disabling fail-fast: false to bail early all make the number look better while making the signal worse. A fast pipeline you cannot trust is worse than a slow one you can.