Why centralized logging matters
When services fail, where do you look first?
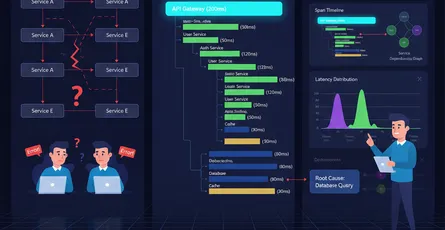
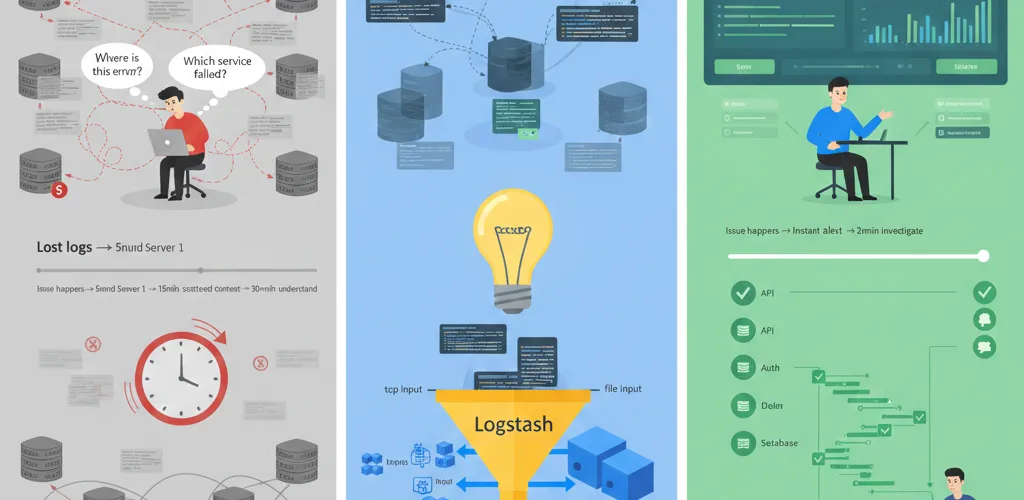
In a distributed system, logs scatter across servers, containers and regions. One request might touch five services. When it breaks, you’re opening log files on several machines, without the context to connect them, and losing whatever the restarted container was holding.
Centralized logging puts all of it in one searchable index, with the fields you need to correlate one request across services.
What poor logging costs you
- Slow debugging: 30+ minutes to find what went wrong 5 minutes ago
- Lost logs: Container restarts = logs disappear and are never recovered
- No correlation: Can’t trace a request across multiple services
- Manual hunting: SSH + grep through millions of lines
- No alerting: You wake up to customer complaints, not alerts
The problem: distributed logs
Why per-server logs aren’t enough
2026-03-21 10:15:23 Error: Database connection refused
# Server 2: /var/log/app.log (you don't see this for 15 minutes)2026-03-21 10:15:22 Error: Database connection refused
# Server 3: Combined, these tell a story, but:# - They're on 3 different machines# - You can't search them together# - Container restart and logs are gone# - You have no context (which user? which request?)
The fix: the ELK stack
What ELK is
- Elasticsearch: Distributed search and analytics engine. Stores logs as searchable documents with full-text indexing.
- Logstash: Log processing pipeline. Collects, parses, enriches, and routes logs to Elasticsearch.
- Kibana: Visualization and exploration platform. Query logs with SQL-like syntax, build dashboards, set alerts.
What you get
- Centralized: All logs in one place, searchable in milliseconds
- Scalable: Handles billions of logs without slowdown
- Structured: JSON-based searching and filtering
- Correlated: Trace requests across multiple services
- Persistent: No data loss when services restart
- Alertable: Triggered notifications on patterns
How the pieces fit together
Services → Filebeat/Logstash → Elasticsearch ← Kibana (Query/Visualize) ↓ ↓ ↓App logs Parse, enrich Index, store, analyzeDB logs Filter, route Full-text searchSystem logs Add context Real-time updatesGetting started with ELK
Docker Compose setup
services: elasticsearch: image: docker.elastic.co/elasticsearch/elasticsearch:8.11.0 container_name: elasticsearch environment: discovery.type: single-node xpack.security.enabled: false xpack.security.transport.ssl.enabled: false ports: - '9200:9200' volumes: - elasticsearch-data:/usr/share/elasticsearch/data
kibana: image: docker.elastic.co/kibana/kibana:8.11.0 container_name: kibana ports: - '5601:5601' environment: ELASTICSEARCH_HOSTS: http://elasticsearch:9200 depends_on: - elasticsearch
logstash: image: docker.elastic.co/logstash/logstash:8.11.0 container_name: logstash volumes: - ./logstash.conf:/usr/share/logstash/pipeline/logstash.conf ports: - '5000:5000' environment: discovery.seed_hosts: elasticsearch LS_JAVA_OPTS: '-Xmx256m -Xms256m' depends_on: - elasticsearch
volumes: elasticsearch-data:Start the stack:
docker compose up -d# Kibana available at http://localhost:5601# Elasticsearch at http://localhost:9200Structured logging with JSON
Why structure the log line
// Good: Structured (searchable, filterable){"timestamp": "2026-03-21T10:15:23Z", "service": "user-api", "level": "ERROR", "message": "Database connection failed", "user_id": 42, "request_id": "req-abc-123", "error_code": "DB_CONN_REFUSED", "retry_count": 3}
// Bad: Unstructured (exact string matching only)"2026-03-21 10:15:23 ERROR [user-api] Database connection failed for user 42 in request req-abc-123"Logging from your application
Python:
import jsonimport loggingfrom pythonjsonlogger import jsonlogger
# Configure JSON logginglogHandler = logging.StreamHandler()formatter = jsonlogger.JsonFormatter()logHandler.setFormatter(formatter)logger = logging.getLogger()logger.addHandler(logHandler)logger.setLevel(logging.INFO)
# Use logging with contextlogger.info("User login", extra={ "user_id": 42, "request_id": "req-abc-123", "service": "user-api", "ip_address": "192.168.1.1"})
logger.error("Database connection failed", extra={ "user_id": 42, "request_id": "req-abc-123", "service": "user-api", "error_code": "DB_CONN_REFUSED", "retry_count": 3})Node.js:
import winston from 'winston';
const logger = winston.createLogger({ format: winston.format.json(), defaultMeta: {service: 'api-gateway'}, transports: [new winston.transports.Console()],});
// Log with contextlogger.info('User authenticated', { user_id: 42, request_id: 'req-abc-123', ip_address: '192.168.1.1',});
logger.error('Database connection failed', { user_id: 42, request_id: 'req-abc-123', error_code: 'DB_CONN_REFUSED', retry_count: 3,});Logstash configuration
A basic pipeline
input { tcp { port => 5000 codec => json }
# Read from files file { path => "/var/log/app/*.log" codec => json }}
filter { # Parse and enrich logs if [service] == "api-gateway" { mutate { add_field => { "service_tier" => "frontend" } } }
# Extract request ID from logs for correlation grok { match => { "message" => "request_id=%{NOTSPACE:request_id}" } }
# Add timestamp if missing date { match => [ "timestamp", "ISO8601" ] target => "@timestamp" }}
output { elasticsearch { hosts => ["elasticsearch:9200"] index => "logs-%{+YYYY.MM.dd}" }
# Also output to stdout for debugging stdout { codec => rubydebug }}Parsing logs from several services
input { tcp { port => 5000 codec => json }}
filter { # Normalize service names translate { field => "service" destination => "service_normalized" dictionary => { "user-api" => "user-service" "user_api" => "user-service" "users" => "user-service" } }
# Add environment if not present if ![environment] { mutate { add_field => { "environment" => "production" } } }
# Parse error stack traces if [level] == "ERROR" and [stack_trace] { mutate { split => { "stack_trace" => "\n" } } }}
output { elasticsearch { hosts => ["elasticsearch:9200"] index => "logs-%{environment}-%{+YYYY.MM.dd}" }}Querying logs in Kibana
Creating index patterns
In Kibana:
- Go to Stack Management → Index Patterns
- Create pattern:
logs-*(matcheslogs-2026.03.21, etc.) - Set timestamp field to
@timestamp
Basic searches
# Find all ERROR logslevel: ERROR
# Errors in specific servicelevel: ERROR AND service: "user-api"
# Errors for specific userlevel: ERROR AND user_id: 42
# Errors in time range (last 1 hour)level: ERROR AND @timestamp: [now-1h TO now]
# Request tracing across servicesrequest_id: "req-abc-123"More of the Kibana Query Language (KQL)
# Multiple conditionsservice: "user-api" AND level: "ERROR" AND response_time_ms > 1000
# Wildcard matchingservice: "user-*" AND message: "*connection*"
# Range querieshttp_status_code: [400 TO 599] AND @timestamp: [now-1d/d TO now]
# Logical operators(service: "payment-api" OR service: "billing-api") AND level: "ERROR"
# Existserror_trace:*Building dashboards
A monitoring dashboard
Dashboard: "Microservices Health"
1. **Error Rate Panel** (Line chart) - Query: level: "ERROR" - Group by: service (X-axis), time (series) - Show: errors per minute
2. **Response Time Panel** (Bar chart) - Query: All logs - Metric: avg(response_time_ms) - Breakdown by: service
3. **Top Errors Panel** (Table) - Query: level: "ERROR" - Top 10: error_code
4. **Request Volume Panel** (Metric) - Query: All logs - Show: total request countSetting up alerts
Alert: error rate spike
# In Kibana: Stack Management → Alerting → Create Rule
Condition: When: average(level: "ERROR") is greater than 100 For: the last 5 minutes
Action: Webhook: POST to Slack channel Message: "Error rate spiked in production"Alert: a specific error pattern
Condition: When: count(error_code: "DB_CONN_REFUSED") is greater than 10 For: the last 2 minutes
Action: Send to PagerDuty Message: "Database connection failures detected"Log retention
Index lifecycle management (ILM)
{ "policy": "logs-policy", "phases": { "hot": { "min_age": "0d", "actions": { "rollover": { "max_primary_store_size": "50GB", "max_age": "1d" } } }, "warm": { "min_age": "7d", "actions": { "set_replicas": { "number_of_replicas": 1 } } }, "cold": { "min_age": "30d", "actions": { "searchable_snapshot": { "snapshot_repository": "my_repository" } } }, "delete": { "min_age": "90d", "actions": { "delete": {} } } }}Request tracing with correlation IDs
Adding a request ID
from fastapi import Requestimport uuidimport logging
logger = logging.getLogger(__name__)
async def add_request_id(request: Request, call_next): # Generate or extract request ID request_id = request.headers.get("X-Request-ID") or str(uuid.uuid4())
# Store in request state request.state.request_id = request_id
# Log with correlation logger.info("Request started", extra={ "request_id": request_id, "method": request.method, "path": request.url.path })
response = await call_next(request)
# Add to response headers for client response.headers["X-Request-ID"] = request_id
return responsePassing the request ID between services
# When calling another serviceimport httpx
async def call_user_service(request): request_id = request.state.request_id
async with httpx.AsyncClient() as client: response = await client.get( "http://user-api/users/42", headers={"X-Request-ID": request_id} # Pass it along )
return response.json()Best practices
1. Log the right amount
# Good: Structured context without redundancylogger.info("Payment processed", extra={ "user_id": 42, "request_id": "req-abc", "amount": 99.99, "currency": "USD"})
# Bad: Too verboselogger.info(f"User with ID 42 has processed a payment of 99.99 USD via request req-abc at {timestamp}")2. Use the same field names everywhere
// Across all services, use same field names{ "timestamp": "2026-03-21T10:15:23Z", "level": "ERROR", "service": "user-api", "user_id": 42, "request_id": "req-abc"}3. Add context to errors
try: result = db.query(...)except Exception as e: logger.error("Database query failed", extra={ "error_type": type(e).__name__, "error_message": str(e), "query": query, # What failed? "user_id": user_id, # Who was affected? "request_id": request_id # Trace it })4. Plan your indices
# Keep recent data hot (highly available)# Archive old data (cost-effective)# Delete after retention period
Daily indices: logs-2026.03.21, logs-2026.03.22Retention: 90 days hot + searchable, 1 year archival, then deleteWrapping up
One searchable index turns a half-hour of log hunting into a query.
The part that pays for itself is structured JSON with a request ID in every line. Do that before you touch Kibana, because a centralized pile of unstructured strings is still a pile. Add OpenTelemetry traces alongside it and you have both halves: logs for what happened inside a service, traces for the path between them.