Observability & Monitoring
Terms for understanding system health: metrics, logs, traces, SLIs, SLOs, alerting, and the pillars of observability.
A quick-reference glossary for making sense of system health: the three pillars (metrics, logs, traces), the reliability vocabulary (SLI, SLO, error budget, burn rate), how good alerting works, and the tools and analysis patterns you meet along the way.
No terms found
Try adjusting your search query
Alerting
7
Alert
An automated notification triggered when a condition is met. Good alerts are actionable and tied to customer impact.
Alert fatigue
The desensitization that happens when people receive too many alerts, especially noisy or non-actionable ones, so they start ignoring the pager, including real incidents.
Symptom-based alerting
Alerting on what users experience (errors, latency) rather than on causes (CPU, memory). It keeps pages meaningful because every one maps to real impact.
Multi-window burn-rate alert
An alert that fires only when both a short and a long window show a high error-budget burn rate, catching fast outages while ignoring brief blips.
Paging vs ticketing
Routing severity by urgency: a fast burn pages a human immediately, while a slow burn opens a ticket for the next working day.
On-call
The rotation of engineers responsible for responding to alerts for a service during a shift.
MTTR (Mean Time To Recovery)
The average time to restore service after an incident begins. A common reliability metric alongside MTBF (mean time between failures).
Analysis
7
Golden signals
The four signals Google recommends watching for any user-facing system: latency, traffic, errors, and saturation.
RED method
A dashboard pattern for request-driven services: Rate, Errors, and Duration.
USE method
A pattern for resources: Utilization, Saturation, and Errors, useful for diagnosing infrastructure like CPU, disk, and network.
Percentile latency
Latency reported at a rank rather than an average, like p99 (the value 99% of requests come in under). Percentiles reveal the slow tail that averages hide.
Dashboard
A curated set of charts giving an at-a-glance view of a service's health, usually built around the golden signals or an SLO.
Root cause analysis
The investigation, often after an incident, that traces a symptom back to its underlying cause, typically using logs and traces together.
Distributed tracing
Following a single request across service boundaries by propagating a trace context, so you can see which hop was slow or failed.
Fundamentals
7
Observability
The ability to understand a system's internal state from the data it emits, so you can answer questions you did not anticipate in advance.
Monitoring
Collecting and alerting on predefined signals to tell you whether known conditions are healthy. Monitoring answers "what" and "when"; observability helps with "why".
Metrics
Numeric measurements sampled over time, such as request rate, error count, or latency. Cheap to store and query, ideal for dashboards and alerts.
Logs
Timestamped, often text records of discrete events. Rich in detail and good for root-cause analysis, but more expensive to store and search at scale.
Traces
Records of a single request as it moves across services, showing the path and timing of each step. Essential for debugging distributed systems.
Span
One unit of work within a trace (for example, a single service call or database query). Spans nest to form the full trace.
Cardinality
The number of unique label combinations on a metric. High cardinality (like a label per user ID) explodes storage and cost, so it is a common source of monitoring bills getting out of control.
Instrumentation & Tools
8
OpenTelemetry
A vendor-neutral standard and set of SDKs for generating and exporting metrics, logs, and traces, so you are not locked into one backend.
Prometheus
A widely used open-source metrics system that scrapes time-series data and queries it with PromQL. The de facto standard for Kubernetes metrics.
PromQL
Prometheus's query language for selecting and aggregating time series, used to build dashboards, recording rules, and alerts.
Grafana
An open-source visualization tool that builds dashboards over metrics, logs, and traces from many data sources.
Exporter
A small process that exposes a system's metrics in a format a collector (like Prometheus) can scrape, for software that does not emit them natively.
Scrape interval
How often a metrics collector pulls fresh samples from a target. Shorter intervals mean more resolution but more storage.
Structured logging
Emitting logs as machine-parseable key/value data (usually JSON) instead of free-form text, so they can be filtered and aggregated reliably.
Sampling
Keeping only a fraction of traces (or logs) to control cost and volume. Head sampling decides up front; tail sampling decides after seeing the whole trace.
Reliability Targets
6
SLI (Service Level Indicator)
A measured signal of service quality, usually a ratio of good events to total events, such as the fraction of requests served under 300ms.
SLO (Service Level Objective)
A target for an SLI over a window, like 99.9% of requests succeeding over 30 days. It is the internal reliability goal a team commits to.
SLA (Service Level Agreement)
A contract with customers that includes consequences (like credits) if reliability drops below an agreed level. An SLA is usually looser than the internal SLO.
Error budget
The allowed amount of unreliability, equal to 100% minus the SLO. It is how much failure you can spend before you must stop shipping features and focus on reliability.
Burn rate
How fast you are consuming the error budget relative to the SLO window. A burn rate above 1 means you will exhaust the budget before the window ends.
Toil
Manual, repetitive operational work that scales with the service and has no lasting value. Reducing toil is a core goal of SRE.
Comments
Was this useful?
Continue on this topic
The same subject, covered a different way from the glossary above.
 Article
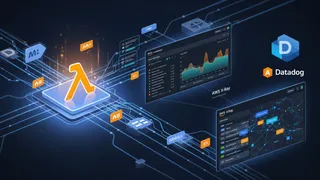
AWS Lambda Observability: Monitoring with CloudWatch, X-Ray, and Datadog
How to monitor AWS Lambda functions with CloudWatch, X-Ray, and Datadog: tracking performance, troubleshooting failures, and cutting costs in serverless applications.
 Dev tip
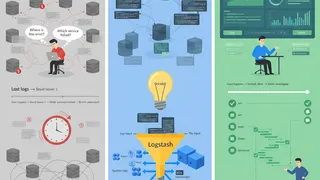
Structured Logging & Log Aggregation with ELK Stack
Centralized logging for microservices with Elasticsearch, Logstash, and Kibana: structured JSON logging, the Logstash pipeline, Kibana dashboards, alerting rules, and index lifecycle policies for production.
 Quiz
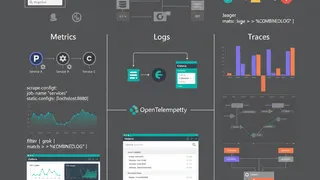
QuizObservability Stack: Monitoring, Logging & Tracing
Master observability fundamentals: monitoring with metrics, structured logging, distributed tracing, and observability practices. Learn to build observable systems and debug production issues.
 Roadmap
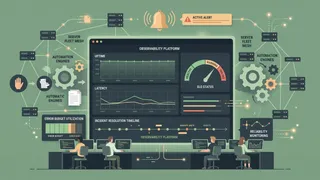
Site Reliability Engineer Beginner to Expert
A roadmap for learning Site Reliability Engineering, from Linux and networking fundamentals to advanced SLOs, observability, incident management, and automation on AWS.
You might also enjoy
More posts on similar topics
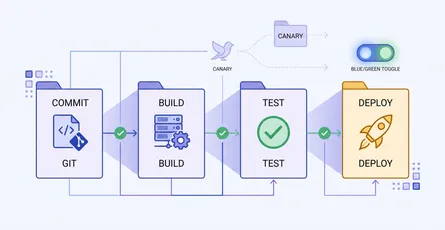
CI/CD & Automation
A quick-reference glossary of the terms you meet when automating builds, tests, and deployments: pipeline anatomy, test gates, and release strategies like canary and blue-green.
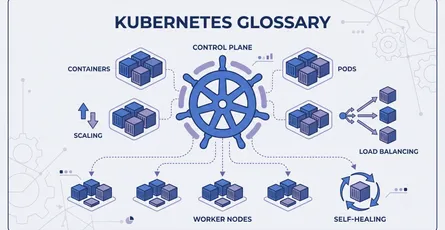
Containers & Kubernetes
This glossary covers essential terms for working with containers and Kubernetes: building Docker images, and managing workloads, networking, storage, scaling, and security in a Kubernetes cluster.
DevOps Basics
This glossary covers foundational terms used in DevOps and cloud engineering, spanning containerization, orchestration, infrastructure as code, CI/CD pipelines, observability, and deployment strategie
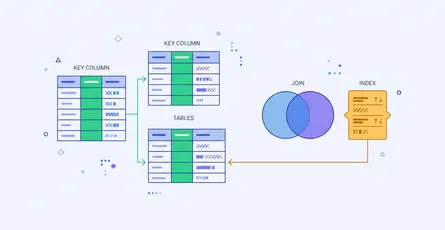
Databases & SQL
Most confusion about SQL is vocabulary rather than syntax. People know how to write a join and still get caught by a LEFT JOIN that quietly behaves like an INNER JOIN, because nobody explained that a
Kubernetes Advanced
This glossary covers the advanced Kubernetes terminology platform engineers rely on: scheduling, networking, storage, security, extensibility, and the workload controllers that keep applications runni
Cloud Computing on AWS
This glossary covers the essential Amazon Web Services terms every cloud engineer and architect should know: compute, storage, networking, databases, and the identity controls that keep it all secure.
6 related posts